FORTUNE 500 Headquarters
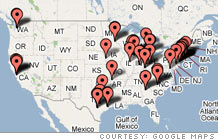
Click to enlarge
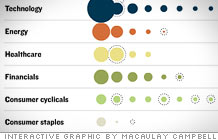
Show FORTUNE 500 Companies:
| 501 |
Telephone & Data Sys.
|
4,265.5 |
338.9 |
| 502 |
Brinker International
|
4,260.2 |
212.4 |
| 503 |
American Financial Grp.
|
4,254.0 |
453.4 |
| 504 |
Con-way
|
4,243.2 |
266.1 |
| 505 |
URS
|
4,240.1 |
113.0 |
| 506 |
PetSmart
|
4,233.9 |
185.1 |
| 507 |
Ikon Office Solutions
|
4,228.2 |
106.2 |
| 508 |
Western Refining
|
4,199.5 |
204.8 |
| 509 |
Giant Industries
|
4,198.2 |
82.8 |
| 510 |
Levi Strauss
|
4,192.9 |
239.0 |
| 511 |
Universal Health Svcs.
|
4,191.5 |
259.5 |
| 512 |
Lubrizol
|
4,184.6 |
105.6 |
| 513 |
Health Management Associates
|
4,160.2 |
182.7 |
| 514 |
Synovus Financial Corp.
|
4,150.1 |
616.9 |
| 515 |
Symantec
|
4,143.4 |
156.9 |
| 516 |
Borders Group
|
4,113.5 |
-151.3 |
| 517 |
Neiman Marcus
|
4,105.6 |
56.6 |
| 518 |
Holly
|
4,077.1 |
266.6 |
| 519 |
MDU Resources Group
|
4,072.5 |
315.8 |
| 520 |
CB Richard Ellis Group
|
4,032.0 |
318.6 |
| 521 |
Stanley Works
|
4,030.6 |
289.5 |
| 522 |
LandAmerica Financial
|
4,015.9 |
98.8 |
| 523 |
OGE Energy
|
4,015.0 |
262.1 |
| 524 |
Robert Half Intl.
|
4,013.5 |
283.2 |
| 525 |
Wisconsin Energy
|
4,010.7 |
316.4 |
| 526 |
CH2M Hill
|
4,006.9 |
38.9 |
| 527 |
Core-Mark Holding
|
4,001.1 |
20.6 |
| 528 |
Sirva
|
3,983.3 |
-52.5 |
| 529 |
Gateway
|
3,980.8 |
9.6 |
| 530 |
Pathmark Stores
|
3,972.8 |
-34.6 |
| 531 |
PepsiAmericas
|
3,972.4 |
158.3 |
| 532 |
Dollar Tree Stores
|
3,969.4 |
192.0 |
| 533 |
Standard Pacific
|
3,964.0 |
123.7 |
| 534 |
ServiceMaster
|
3,948.0 |
169.7 |
| 535 |
OSI Restaurant Partners
|
3,941.0 |
100.2 |
| 536 |
United Rentals
|
3,920.0 |
224.0 |
| 537 |
FMC Technologies
|
3,918.0 |
276.3 |
| 538 |
Washington Post
|
3,904.9 |
324.5 |
| 539 |
EOG Resources
|
3,904.4 |
1,299.9 |
| 540 |
Popular
|
3,873.9 |
357.7 |
| 541 |
Michaels Stores
|
3,865.0 |
41.2 |
| 542 |
Rockwell Collins
|
3,863.0 |
477.0 |
| 543 |
Insight Enterprises
|
3,851.2 |
76.2 |
| 544 |
Jarden
|
3,846.3 |
106.0 |
| 545 |
E*Trade Financial
|
3,845.5 |
628.9 |
| 546 |
Wyndham Worldwide
|
3,842.0 |
287.0 |
| 547 |
CA
|
3,805.0 |
159.0 |
| 548 |
Old Republic Intl.
|
3,794.2 |
464.8 |
| 549 |
Thermo Fisher Scientific
|
3,791.6 |
168.9 |
| 550 |
Alberto-Culver
|
3,772.0 |
205.3 |
| 551 |
WellCare Health Plans
|
3,762.9 |
139.2 |
| 552 |
Polo Ralph Lauren
|
3,746.3 |
308.0 |
| 553 |
Cameron International
|
3,742.9 |
317.8 |
| 554 |
Williams-Sonoma
|
3,727.5 |
208.9 |
| 555 |
Chemtura
|
3,722.7 |
-205.5 |
| 556 |
Consol Energy
|
3,715.2 |
408.9 |
| 557 |
Live Nation
|
3,691.6 |
-31.4 |
| 558 |
Armstrong World Industries
|
3,679.7 |
1,358.0 |
| 559 |
Lennox International
|
3,671.1 |
166.0 |
| 560 |
Broadcom
|
3,667.8 |
379.0 |
| 561 |
General Cable
|
3,665.1 |
135.3 |
| 562 |
Wendy's International
|
3,660.3 |
94.3 |
| 563 |
Sonoco Products
|
3,656.8 |
195.1 |
| 564 |
Bemis
|
3,639.4 |
176.3 |
| 565 |
Manor Care
|
3,613.2 |
167.1 |
| 566 |
Nalco Holding
|
3,602.6 |
98.9 |
| 567 |
Laboratory Corp. of America
|
3,590.8 |
431.6 |
| 568 |
Precision Castparts
|
3,580.1 |
350.6 |
| 569 |
NSTAR
|
3,577.7 |
206.8 |
| 570 |
Saks
|
3,564.3 |
53.7 |
| 571 |
Bowater
|
3,529.8 |
-138.3 |
| 572 |
Warner Music Group
|
3,516.0 |
60.0 |
| 573 |
Universal
|
3,511.3 |
7.9 |
| 574 |
Stater Bros. Holdings
|
3,508.8 |
26.1 |
| 575 |
First Horizon National Corp.
|
3,496.0 |
462.9 |
| 576 |
Zimmer Holdings
|
3,495.4 |
834.5 |
| 577 |
Harris
|
3,474.8 |
237.9 |
| 578 |
FM Global
|
3,474.4 |
736.9 |
| 579 |
Burlington Coat Factory
|
3,470.6 |
67.2 |
| 580 |
Meritage Homes
|
3,461.3 |
225.4 |
| 581 |
Bon-Ton Stores
|
3,455.8 |
46.9 |
| 582 |
TECO Energy
|
3,448.9 |
246.3 |
| 583 |
New York Times
|
3,446.7 |
-543.4 |
| 584 |
Oshkosh Truck
|
3,427.4 |
205.5 |
| 585 |
Harsco
|
3,423.3 |
196.4 |
| 586 |
Torchmark
|
3,421.2 |
518.6 |
| 587 |
Alliant Energy
|
3,406.0 |
315.7 |
| 588 |
Pinnacle West Capital
|
3,405.4 |
327.3 |
| 589 |
Cintas
|
3,403.6 |
327.2 |
| 590 |
Washington Group Intl.
|
3,398.1 |
80.8 |
| 591 |
Belk
|
3,375.4 |
168.7 |
| 592 |
Zions Bancorp
|
3,369.3 |
583.1 |
| 593 |
Sierra Pacific Resources
|
3,355.9 |
279.8 |
| 594 |
Nacco Industries
|
3,349.0 |
106.2 |
| 595 |
Vulcan Materials
|
3,342.5 |
467.5 |
| 596 |
Alaska Air Group
|
3,334.4 |
-52.6 |
| 597 |
Simon Property Group
|
3,332.2 |
563.8 |
| 598 |
Rockwood Holdings
|
3,330.9 |
103.0 |
| 599 |
Cytec Industries
|
3,329.5 |
194.9 |
| 600 |
J.B. Hunt Transport Svcs.
|
3,328.0 |
220.0 |
From the April 30th, 2007 issue
|
| Most profitable companies |
| Fortune 500 methodology |
| Included in the survey are U.S. incorporated companies filing financial statements with a government agency. This includes private companies... (more)
|
|