Our annual ranking of America's largest corporations

153 of 500
BACKNEXT
153. Union Pacific
Financials: Latest Results
Rank: 153 (Previous rank: 164)
CEO: James R. Young
Compare tool: Union Pacific vs. Top 10
Subscribe to Fortune Magazine
Is Union Pacific a great company, or what?
Key financials $ millions % change
from 2009
Revenues 16,965.0 20.0
Profits 2,780.0 46.5
Assets 43,088.0
Stockholders' equity 17,763.0
Market value (3/25/2011) 47,916.8
Profits as % of  
Revenues 16.4
Assets 6.5
Stockholders' equity 15.7
Earnings per share  
2010 $ 5.53
% change from 2009 47.5
2000-2010 annual growth rate % 12.7
Total return to investors %
2010 47.4
2000-2010 annual rate 15.7
Industry: Railroads
Rank Company 500
rank
Revenues
($ millions)
1 Union Pacific 153 16,965.0
2 CSX 230 10,636.0
3 Norfolk Southern 261 9,516.0
Issue date: May 23, 2011
Fortune 500+ Web app
  • Get the download
    Download the ultimate tool to get you inside America's 1,000 biggest companies.
Galleries and more
Headquarters
MAPS
Union Pacific
1400 Douglas St.
Omaha, NE 68179
402-544-5000
www.up.com
Find your top companies
 High revenue growth  High profit growth
 High EPS growth  High return to investors
 Top 5 in its industry  Best company to work for
 Big employer  Small employer


Video

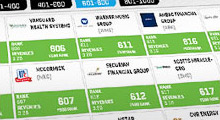
Rank # of Fortune 500 Companies
New York 57
California 53
Texas 51
Company Rank
Microsoft 38
Goldman Sachs 54
Intel 56
Company 2010 $ (millions)
Exxon Mobil $30,460.0
AT&T $19,864.0
Chevron $19,024.0
FAQ and methodology
Included in the survey are U.S. incorporated companies filing financial statements with a government agency. This includes private companies... More
Current Issue
  • Give the gift of Fortune
  • Get the Fortune app
  • Subscribe

Most stock quote data provided by BATS. Market indices are shown in real time, except for the DJIA, which is delayed by two minutes. All times are ET. Disclaimer. Morningstar: © Morningstar, Inc. All Rights Reserved. Factset: FactSet Research Systems Inc. . All rights reserved. Chicago Mercantile Association: Certain market data is the property of Chicago Mercantile Exchange Inc. and its licensors. All rights reserved. Dow Jones: The Dow Jones branded indices are proprietary to and are calculated, distributed and marketed by DJI Opco, a subsidiary of S&P Dow Jones Indices LLC and have been licensed for use to S&P Opco, LLC and CNN. Standard & Poor's and S&P are registered trademarks of Standard & Poor's Financial Services LLC and Dow Jones is a registered trademark of Dow Jones Trademark Holdings LLC. All content of the Dow Jones branded indices © S&P Dow Jones Indices LLC and/or its affiliates.