Get Quote: CVS
Financials: Latest Results
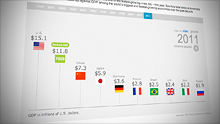
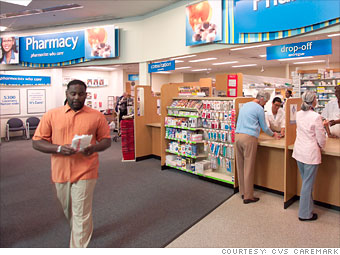
Sales topped $100 billion at the pharmacy giant, but it also faces challenges. The $29.1 billion merger of Express Scripts and Medco knocked CVS off its perch as the largest pharmacy benefits operator. It remains to be seen how the company will cope with such robust new competition. |
Industry: Food and Drug Stores
|
Galleries and more
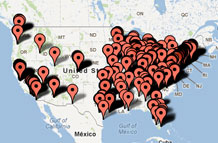
Headquarters
 |

| Rank # of Fortune 500 Companies | |
|---|---|
| California | 53 |
| Texas | 52 |
| New York | 50 |
| Company | Rank |
|---|---|
| 73 | |
| NetApp | 474 |
| NuStar Energy | 377 |