Smart ways to play the M&A boomBuyouts and takeovers are driving the market. Fortune's Yuval Rosenberg tells you how to get in on the action without getting burned.(Fortune Magazine) -- Every week, if not every day, new mergers and acquisitions hit the headlines. Even after a blazing-hot year for dealmaking in 2006, healthy stock prices, accommodating debt markets and private-equity firms flush with cash continue to fuel the frenzy - and those factors are widely expected to remain in place for the remainder of the year. The latest blockbuster: the bidding for ABN Amro, which has topped $100 billion. "It seems as if CEO investment libidos are very strong," says Curtis Jensen, co-chief investment officer of Third Avenue Management in New York. "The odds are that we're going to continue to see a very strong M&A environment for the foreseeable future."
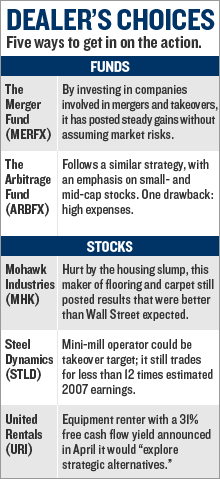
 With so many deals in the news, it's only natural for investors to wonder which company will be bought next - and which stock will be next to see a pop. Before you start chasing rumors, though, bear in mind that you may already be profiting from the action. That's because the M&A wave has buoyed stock prices across the board, a number of market watchers say, by adding another source of demand for shares. In addition, companies' being taken private, combined with the recent spate of stock buybacks by those with large cash hoards, has also served to reduce the overall supply of shares. "Just from a supply-demand perspective, it's lifted all boats," says Bruce Bittles, chief investment strategist for Robert W. Baird & Co. in Nashville. "So the average investor has been benefiting from this already." And the dealmaking may push stocks higher still. Yet speculating on potential takeover targets is a dangerous game, say analysts and strategists, who urge individual investors to remain focused on fundamentals rather than to compete with the pros. That's not to say there aren't ways to play the M&A frenzy. A few specialized mutual funds look to profit from Wall Street wheeling and dealing, using a strategy called merger arbitrage. They will typically invest in announced deals, looking to lock in the difference between the target company's share price and the closing price of the transaction. (That spread roughly reflects the risks that the deal won't go through as announced.) "The strategy, if employed properly and intelligently, can provide a good absolute return in almost every market environment," says Roy Behren, who, along with Fred Green and Michael Shannon, manages the Merger Fund (MERFX), the oldest and largest of the arbitrage mutual funds. The $1.7 billion portfolio has delivered average annual gains of 7.3 percent for the past ten years and had only one losing year in its 18-year existence. A similar strategy has helped the Arbitrage Fund (ARBFX) return 5.2 percent a year over the past five years. Manager John Orrico focuses more on small- and mid-cap deals with appealing spreads for his $165 million portfolio. The fund's big drawback is its high expense ratio of 1.95 percent. Still, with low volatility and a low degree of correlation with the broader equity market, either fund could be a valuable tool for portfolio diversification. For investors who prefer individual stocks, it's best to look for those that can pass what might be termed the Howie Mandel test: They are bargains, deal or no deal. To find stocks that are both attractive on their own and have characteristics that might appeal to corporate raiders, we screened the S&P Mid-Cap 400 with the help of Jack Ablin, chief investment officer of Harris Private Bank in Chicago, looking for companies with rich levels of free cash flow yield and steady, sustainable cash flow growth. We then considered a measure of the companies' valuations that private-equity buyers would focus on: EV/Ebitda. EV stands for enterprise value, which is the total of a company's market capitalization plus debt, minus cash. Ebitda - earnings before interest, taxes, depreciation and amortization - can be a useful gauge of a company's profitability. The EV/Ebitda ratio is thus a fair measure of what a buyer would have to pay relative to the earning power he'd be acquiring. We also considered price/earnings ratios based on estimated 2007 profits. While private-equity investors may not make much use of P/Es - for one thing, a purchaser of an entire company has to add in corporate debt - for ordinary investors the figures still make for a simple way to gauge whether shares are reasonably priced. Not surprisingly, many of the names on the resulting list have seen their share prices move higher recently. The top cash-flow producer on our list was equipment-rental company United Rentals (Charts), which announced in early April that it would explore a potential sale. Shares have already jumped as a result, yet they still trade for about 12 times projected 2007 earnings. Another company to make our cut is Mohawk Industries (Charts, Fortune 500), a maker of carpets and floor coverings based in Calhoun, Ga., with a market value of $6 billion. Shares have soared more than 40 percent above their 52-week low, but they still trade for about 14 times this year's projected earnings. At those levels, it's unlikely that Mohawk investors will have the rug pulled out from under them. The fragmented steel industry has already seen some consolidation - and plenty of speculation about possible targets. One name that could be in the cross hairs based on our screen: Steel Dynamics (Charts). The Fort Wayne-based operator of steel mini-mills recently reported a blowout first quarter, far exceeding Wall Street estimates. The company has also been using its cash to aggressively repurchase stock. As with our other picks, shares have rallied considerably recently, but they also can still be bought for less than 12 times earnings. From the May 14, 2007 issue
|
Sponsors
|

