Back to feature
2. Vero Beach, FL
2. Vero Beach, FL
64% Projected gain in home prices (5-year)*
Median home price Median home price
2006: $235,000
2011: $386,000
Population Population
2006: 131,000
2011: 147,000
Per capita income Per capita income
2006: $44,400
2011: $51,200
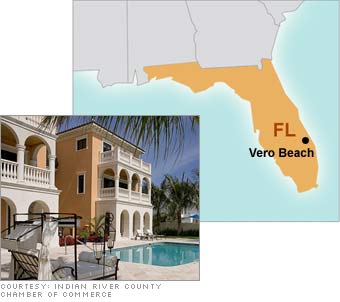
*Metro region statistics


Balmy weather, low property taxes, and a cost of living 3% lower than that of nearby West Palm Beach make this coastal town an affordable alternative, with sandy shores and the best surfing on the East Coast.

"Vero Beach is at high risk in the short term but will move up in the long term," Cochrane says.

Here's why: A Florida Atlantic University study says Indian River County and its two closest neighbors will need a projected 154,000 new homes during the next 25 years to house the growing population and replace old structures. A Manpower Employment Outlook Survey predicts growth in construction, manufacturing, and retail jobs too. Per capita income growth closely shadowed that of Martin County, Florida's second-wealthiest, and is gaining on that of Palm Beach County, the state's richest.

CAUTION: Projected job growth in the region will revolve mainly around lower-wage work, which can dampen home values.

Most stock quote data provided by BATS. Market indices are shown in real time, except for the DJIA, which is delayed by two minutes. All times are ET. Disclaimer. Morningstar: © 2018 Morningstar, Inc. All Rights Reserved. Factset: FactSet Research Systems Inc. 2018. All rights reserved. Chicago Mercantile Association: Certain market data is the property of Chicago Mercantile Exchange Inc. and its licensors. All rights reserved. Dow Jones: The Dow Jones branded indices are proprietary to and are calculated, distributed and marketed by DJI Opco, a subsidiary of S&P Dow Jones Indices LLC and have been licensed for use to S&P Opco, LLC and CNN. Standard & Poor's and S&P are registered trademarks of Standard & Poor's Financial Services LLC and Dow Jones is a registered trademark of Dow Jones Trademark Holdings LLC. All content of the Dow Jones branded indices © S&P Dow Jones Indices LLC 2018 and/or its affiliates.

Most stock quote data provided by BATS. Market indices are shown in real time, except for the DJIA, which is delayed by two minutes. All times are ET. Disclaimer. Morningstar: © 2018 Morningstar, Inc. All Rights Reserved. Factset: FactSet Research Systems Inc. 2018. All rights reserved. Chicago Mercantile Association: Certain market data is the property of Chicago Mercantile Exchange Inc. and its licensors. All rights reserved. Dow Jones: The Dow Jones branded indices are proprietary to and are calculated, distributed and marketed by DJI Opco, a subsidiary of S&P Dow Jones Indices LLC and have been licensed for use to S&P Opco, LLC and CNN. Standard & Poor's and S&P are registered trademarks of Standard & Poor's Financial Services LLC and Dow Jones is a registered trademark of Dow Jones Trademark Holdings LLC. All content of the Dow Jones branded indices © S&P Dow Jones Indices LLC 2018 and/or its affiliates.