Back to feature
9. Fort Collins, CO
9. Fort Collins, CO
28% Projected gain in home prices (5-year)*
Median home price Median home price
2006: $196,000
2011: $251,000
Population Population
2006: 278,000
2011: 306,000
Per capita income Per capita income
2006: $36,600
2011: $48,400
*Metro region statistics


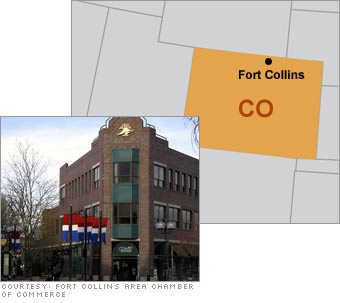
Fort Collins appears time and again on the media's "best" lists - best place to live, best place to retire, best place to raise a family, best "dream" town, even the best place to "reinvent your life."

"Great schools, low crime, good jobs in a high-tech economy," Money Magazine crowed earlier this year when it named Fort Collins its No. 1 small city. And talk about a lifestyle play: The city is an outdoorsman's fantasy come to life, boasting 40 parks within the city limits, more than 60 miles of hiking and biking trails, three city-owned golf courses, and easy access to whitewater rafting, kayaking, fishing, and skiing.

The presence of Colorado State University makes it a college town, to boot. Add to all this that Colorado has been a housing price laggard in recent years, with "relatively anemic" price appreciation, according to economist Andrew Leventis at the Office of Federal Housing Enterprise Oversight. With tech companies fleeing high-priced Silicon Valley, bringing California émigrés with them, now looks like a good time to buy.

CAUTION: Another tech slump could dampen the housing forecast. With large divisions of Agilent Technologies, Eastman Kodak, and Hewlett-Packard based here, the regional economy leans mighty heavily on tech-industry growth.

Most stock quote data provided by BATS. Market indices are shown in real time, except for the DJIA, which is delayed by two minutes. All times are ET. Disclaimer. Morningstar: © 2018 Morningstar, Inc. All Rights Reserved. Factset: FactSet Research Systems Inc. 2018. All rights reserved. Chicago Mercantile Association: Certain market data is the property of Chicago Mercantile Exchange Inc. and its licensors. All rights reserved. Dow Jones: The Dow Jones branded indices are proprietary to and are calculated, distributed and marketed by DJI Opco, a subsidiary of S&P Dow Jones Indices LLC and have been licensed for use to S&P Opco, LLC and CNN. Standard & Poor's and S&P are registered trademarks of Standard & Poor's Financial Services LLC and Dow Jones is a registered trademark of Dow Jones Trademark Holdings LLC. All content of the Dow Jones branded indices © S&P Dow Jones Indices LLC 2018 and/or its affiliates.

Most stock quote data provided by BATS. Market indices are shown in real time, except for the DJIA, which is delayed by two minutes. All times are ET. Disclaimer. Morningstar: © 2018 Morningstar, Inc. All Rights Reserved. Factset: FactSet Research Systems Inc. 2018. All rights reserved. Chicago Mercantile Association: Certain market data is the property of Chicago Mercantile Exchange Inc. and its licensors. All rights reserved. Dow Jones: The Dow Jones branded indices are proprietary to and are calculated, distributed and marketed by DJI Opco, a subsidiary of S&P Dow Jones Indices LLC and have been licensed for use to S&P Opco, LLC and CNN. Standard & Poor's and S&P are registered trademarks of Standard & Poor's Financial Services LLC and Dow Jones is a registered trademark of Dow Jones Trademark Holdings LLC. All content of the Dow Jones branded indices © S&P Dow Jones Indices LLC 2018 and/or its affiliates.