|
Grumbling grows among airline passengers
Government report shows nearly 10,000 lost bags a day, increase in arrival delays.
NEW YORK (CNNMoney.com) - It was tougher to be a passenger on a U.S. airline in 2005, according to government statistics, which show almost 10,000 lost baggage reports a day during the year, as well as increases in the other problems that can make a flight unpleasant. U.S. airlines saw more than a 26 percent jump in reports of mishandled baggage during the year by the top 20 reporting airlines to 9,735, coupled with 17.2 percent more complaints about airline service, according to figures from the Department of Transportation.
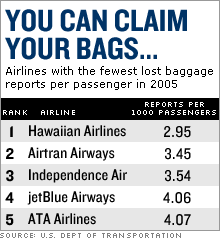
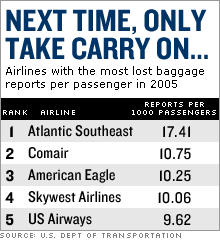
The statistics also show more passengers bumped involuntarily due to overbooking and those that did get on their flights saw increases in flight delays, diversions and cancellations. For the 20 major reporting airlines, the number of delayed arrivals rose 3 percent, giving them a rate of delayed arrival of just over one flight in five, the highest rate since 2000. Flight cancellations rose nearly 5 percent to 366 a day. Flight diversions rose by 1.8 percent. The four worst airlines in terms of lost bags all operate as feeder carriers for the major airlines. Atlantic Southeast Airlines, which operates at Delta Connection, had 17.4 lost bag reports per 1,000 customers, by far the worst of the 19 ranked carriers. Another Delta Connection carrier, Comair, was next with 10.75 lost bag reports per 1,000 passengers, followed by a rate of 10.25 reports at American Eagle, owned by American Airlines parent AMR Corp (Research), for which it serves as a feeder. Skywest (Research), which flies as Delta Connection and United Express and which purchased Atlantic Southeast from Delta Air Lines (Research) in September just before Delta's bankruptcy, is the only other airline with more than 10 lost bag reports per 1,000 passengers, with 10.06. Among the major carriers, US Airways (Research), which includes both the former US Airways and America West, which purchased it in 2005, had the worst record with 9.62 lost bag reports per 1,000 customers, followed by Delta, with a rate of 7.09 lost bags. Both saw big jumps from rates close to five such reports per 1,000 customers in 2004. On the other end of the listings, Hawaiian Airlines (Research), which exited bankruptcy in 2005, had only 2.95 reports per 1,000 bags. Not rewarded
But a good record on baggage doesn't necessarily translate to good financial results. Independence Air saw its lost-bag report rate improve dramatically to 3.54 from 10.68 in 2004, when it was formerly operating as a feeder airline. It was good enough to be third best, behind Hawaiian and AirTran Airways (Research). But Independence filed for bankruptcy in November and halted operations in early January. Part of the problem may have been because planes were fuller than ever before in 2005. The Air Transport Association, the industry trade group, reported that its members filled a record 78.5 percent of seats in 2005, while handling 553.8 million passengers. With so many flights at capacity, it's not surprising DOT stats showed more than a 6.4 percent increase in passengers who were involuntarily bumped from flights due to overbooking, to 47,774. ATA Airlines (Research), another bankrupt carrier, had the highest rate of involuntarily bumped passengers with 2.75 per 10,000 passengers, followed by Continental (Research), with 1.92. The best record in that measure was JetBlue (Research), which the government reports had no involuntary bumped passengers last year. Passengers also paid slightly more to fly last year. The average domestic fare edged up 1.9 percent for the full year, to an average of 11.74 cents a mile, according to the ATA report. That was the first increase in those fares since 2000. But the slightly higher fares didn't make up for increased fuel costs, which soared 46 percent during the course of the first 11 months of the year. Fuel makes up the second largest cost after labor for airlines. In addition to the bankruptcy at No. 3 Delta Air Lines, No. 4 Northwest Airlines (Research) also filed for bankruptcy court protection. The squeeze also probably worked against improved service. The major airline with the highest rate of passenger complaints filed with the DOT was US Airways, with 1.86 per 100,000 passengers, followed by Independence Air, which saw 1.68 complaints despite its improved record on baggage handling.
The nation's three largest airlines, American, United (Research) and Delta, each had just over one complaint per 100,000 passengers, but that badly trailed the leaders, Southwest Airlines (Research), which had only 0.18 complaints per 100,000 passengers, and JetBlue, which had only 0.29. |
|


