NEW YORK (CNNMoney) -- Medicare, Medicaid and Social Security are three of the government's most popular and relied upon programs.
So why does Congress need to curb the growth in spending on them?
First answer: It's the biggest driver of the long-term national debt.
Eliminate all the waste, fraud and abuse you can find. Cut even more out of discretionary programs, including defense. And tax the heck out of Warren Buffett and his pals. All those moves combined still won't do enough to rein in national debt.
That's because they're not the main cause of long-term deficits. An aging population and rising health care costs are. So is the fact that there will be fewer workers per retiree paying taxes into the programs.
As a result spending on Medicare, Medicaid and, to a lesser degree, Social Security will rise greatly absent structural changes, especially in the way health care is delivered and reimbursed.
When measured as a percent of the economy, spending on the three entitlement programs will rise to between 16% and 17% in 2035 from roughly 10% of GDP today, according to projections from the Congressional Budget Office.
To put that into context, over the past four decades the federal government has spent an average of 18.5% of GDP for everything in the federal budget except interest.
Second answer: If no changes are made, future retirees' benefits could be cut abruptly.
The longer policymakers wait to reduce growth in entitlement spending, the harsher changes will be once the funding shortfalls hit full force. And that means future retirees won't have enough time to plan for the change.
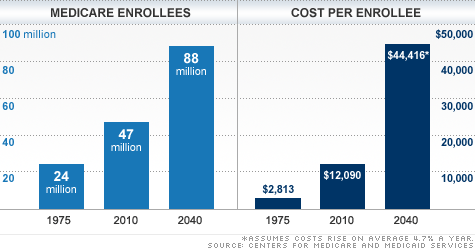
The number of people using Medicare is growing quickly. And the number of workers paying taxes into the system is declining.
Between 1975 and 2010, enrollees doubled to 47 million, and the real cost per person quadrupled, according to the Centers for Medicare and Medicaid Services. By 2040, Medicare will cover 88 million enrollees and the cost per enrollee is projected to nearly triple.
Medicare's hospital insurance program, otherwise known as Part A, can only pay full benefits through 2024, according to the program's trustees.
Medicaid is jointly financed by federal and state governments, with Uncle Sam footing more than half of the bill.
Over much of the next decade, spending on that program is expected to rise by 9% a year on average, the CBO estimates. As a share of the economy, Medicaid spending is projected to nearly double between now and 2035.
Social Security is another story. It has not contributed to the accrual of the country's current debt load.
In fact, Social Security has helped to keep federal deficits lower than they otherwise would have been because the federal government borrowed the surplus revenue paid into the program since the 1980s. And federal spending on the program is expected to grow much more slowly than on Medicare.
But after 2036, Social Security will only be able to pay 77% of promised retirement benefits.
The financial outlook for Social Security disability benefits, meanwhile, is worse. The money dedicated to pay those benefits is projected to run out by 2018.
Third answer: Taxing the rich alone won't cut it
There may be good reasons to ask the wealthiest to pay more in taxes to help with debt reduction. But solely relying on them -- even in conjunction with some defense spending cuts -- won't help nearly as much as hoped.
For one thing, under the current tax code, their income tax rates would have to be jacked up to nosebleed levels.
That wouldn't fly politically. Nor would it make economic sense. The higher rates are, the more they would likely affect economic behavior -- in this case encouraging tax avoidance and discouraging otherwise growth-spurring investments. That, in turn, can reduce the revenue raised.
Plus, there just aren't enough rich folks to go around. And their income is typically more volatile than most people's. So when the economy sours or markets crash, so often does the taxable income of the well-to-do. ![]()
| Overnight Avg Rate | Latest | Change | Last Week |
|---|---|---|---|
| 30 yr fixed | 3.80% | 3.88% | |
| 15 yr fixed | 3.20% | 3.23% | |
| 5/1 ARM | 3.84% | 3.88% | |
| 30 yr refi | 3.82% | 3.93% | |
| 15 yr refi | 3.20% | 3.23% |
Today's featured rates:
| Latest Report | Next Update |
|---|---|
| Home prices | Aug 28 |
| Consumer confidence | Aug 28 |
| GDP | Aug 29 |
| Manufacturing (ISM) | Sept 4 |
| Jobs | Sept 7 |
| Inflation (CPI) | Sept 14 |
| Retail sales | Sept 14 |