Search News

There were fewer foreclosed homes in November, but the outlook for the New Year isn't bright.
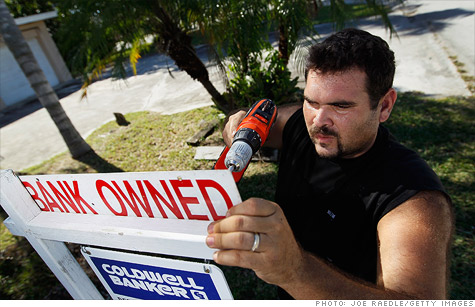
NEW YORK (CNNMoney) -- Foreclosure filings may have fallen in November but the number of homes scheduled for bank auctions grew significantly, indicating that a new wave of foreclosures are set to take place in the New Year.
The number of foreclosure filings dropped to 224,394 properties in November, a 3% decline from October and a 14% drop year-over-year, according to RealtyTrac.
During the month, one in every 579 housing units received either a default notice or underwent a scheduled auction or bank repossession, the online marketer of foreclosed homes said.
The number of completed foreclosures, the last stage of the process when banks repossess the homes of delinquent borrowers, fell to 56,124 homes, a 17% plunge from a month earlier and the fewest since March 2008. Such repossessions are off 45% from their September 2010 peak, when more than 102,000 homes were lost to foreclosure.
Foreclosure filings have been artificially depressed for more than a year now as banks slowed the processing of paperwork in the wake of the robo-signing scandal.
"The banks had taken some of the homes out of the foreclosure pipeline while they cleaned up their books," said Pat Newport, a housing market analyst for IHS Global Insight.
The paperwork issues have been mostly resolved and that could mean bank repossessions will come roaring back in 2012, said James Saccacio, CEO of RealtyTrac.
"Despite a seasonal slowdown similar to what we've seen in each of the past four years, November's numbers suggest a new set of incoming foreclosure waves, many of which may roll into the market as REO's or short sales sometimes early next year," he said.
Among the most telling of RealtyTrac's statistics was a significant jump in scheduled auction sales, which grew 13% from October and stood at a nine-month high of 96,540 properties.
"Many of the new defaults that started the foreclosure process over the past few months are now being scheduled for public foreclosure auction," said Saccacio.
However, there was some good news concerning initial default notices, when banks first send out legal papers to borrowers informing them that they have missed at least one payment. The number of notices fell 8% month-over-month and are down 9% from 12 months earlier.
Still, according to Newport, there are as many as 6 million mortgage borrowers who have missed payments and, with the economy still struggling, the prospects for many of those borrowers are dim.
"In most cases, their problems will be resolved through foreclosure," he said.
Nevada continued to lead the country in defaults in November, taking the number one spot for the 59th month in a row. In the state, one in every 175 housing units received a foreclosure filing during the month.
California cities dominated the list of metro area with the highest foreclosure rates: Nine out of the top 10 highest were in California. Only Las Vegas, with one foreclosure filing per every 150 housing units, broke the Golden State's stranglehold.
Stockton, with one filing for every 120 housing units, posted the nation's highest foreclosure rate for the second month in a row. The Central Valley city had 1,913 properties with foreclosure filings in November, up 20% from October. ![]()
| Overnight Avg Rate | Latest | Change | Last Week |
|---|---|---|---|
| 30 yr fixed | 3.80% | 3.88% | |
| 15 yr fixed | 3.20% | 3.23% | |
| 5/1 ARM | 3.84% | 3.88% | |
| 30 yr refi | 3.82% | 3.93% | |
| 15 yr refi | 3.20% | 3.23% |
Today's featured rates: