3 of 11
BACKNEXT
Agrium
Agrium
Market cap: $14.5 billion
2010 Revenue: $10.5 billion
P/E Ratio: 19.9
Dividend Yield: 0.1%
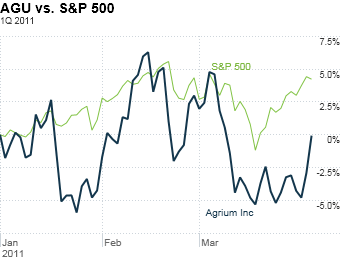
Stock price change for 1Q: 0.6%
Ticker: AGU

Agrium was supposed to perform well for the same reasons as Mosaic -- it's a fertilizer company that stands to benefit from the high price of crops fueling agricultural growth. Unlike Mosaic, however, Agrium's profits are more directly tied to the price of natural gas. Agrium needs the gas to make its main product -- nitrogen fertilizer.

But low gas prices don't necessarily equal smooth sailing for Agrium. According to an analyst report by J.P. Morgan, one risk of this is that low natural gas prices could spur competitors to start producing more nitrogen fertilizer, which could put pressure on Agrium's profit margins.

Why Agrium made the list


NEXT: Dow Chemicals
Last updated April 06 2011: 12:29 PM ET
Stock data as of market close, 03/31/11.
10 best stocks for 2011 Investors' fears that a bear market will return (and linger) has made for some bargains - and this group should thrive even if inflation returns. More
The 10 best cities for home buyersYou better believe it -- the real estate market is back. It's time to buy again, and here are the 10 cities with the most affordable homes, according to a new report from Deutsche Bank. More
Five popular tax breaks on the brink of extinction From energy savings to college costs, Americans are getting a lot of breaks from Uncle Sam during this tax season. But get them while they last -- the good times are about to end. More

Most stock quote data provided by BATS. Market indices are shown in real time, except for the DJIA, which is delayed by two minutes. All times are ET. Disclaimer. Morningstar: © 2018 Morningstar, Inc. All Rights Reserved. Factset: FactSet Research Systems Inc. 2018. All rights reserved. Chicago Mercantile Association: Certain market data is the property of Chicago Mercantile Exchange Inc. and its licensors. All rights reserved. Dow Jones: The Dow Jones branded indices are proprietary to and are calculated, distributed and marketed by DJI Opco, a subsidiary of S&P Dow Jones Indices LLC and have been licensed for use to S&P Opco, LLC and CNN. Standard & Poor's and S&P are registered trademarks of Standard & Poor's Financial Services LLC and Dow Jones is a registered trademark of Dow Jones Trademark Holdings LLC. All content of the Dow Jones branded indices © S&P Dow Jones Indices LLC 2018 and/or its affiliates.