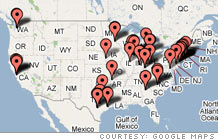
FORTUNE 500 Headquarters

Click to enlarge
Show FORTUNE 500 Companies:
Other lists
This company also appears on other rankings. Most recently:
| Revenues |
9,870.0 |
9.5 |
| Profits |
1,064.3 |
15.8 |
| Assets |
143,658.1 |
— |
| Stockholders' Equity |
7,860.8 |
— |
| Market Value 3/23/2007 |
16,300.4 |
— |
| Revenues |
10.8 |
| Assets |
0.7 |
| Stockholders' equity |
13.5 |
| 2006 $ |
3.74 |
| % change from 2005 |
20.3 |
| 1996-2006 annual growth rate % |
N.A. |
| 2006 |
25.5 |
| 1996-2006 annual rate |
N.A. |
| 1 |
MetLife
|
37 |
53,275.0 |
| 2 |
Prudential Financial
|
66 |
32,488.0 |
| 3 |
AFLAC
|
164 |
14,616.0 |
| 4 |
Genworth Financial
|
227 |
11,029.0 |
| 5 |
Unum Group
|
236 |
10,718.8 |
| 6 |
Principal Financial
|
250 |
9,870.0 |
| 7 |
Lincoln National
|
277 |
9,062.9 |
| 8 |
Assurant
|
300 |
8,070.6 |
| 9 |
Pacific Life
|
437 |
5,201.9 |
| 10 |
Conseco
|
493 |
4,467.4 |
| 11 |
Torchmark
|
586 |
3,421.2 |
| 12 |
American National Ins.
|
632 |
3,114.4 |
| 13 |
Protective Life
|
700 |
2,679.1 |
| 14 |
Phoenix
|
726 |
2,578.0 |
| 15 |
StanCorp Financial
|
746 |
2,492.9 |
| 16 |
Minnesota Life Ins.
|
756 |
2,450.2 |
| 17 |
HealthMarkets
|
826 |
2,113.0 |
From the April 30th, 2007 issue

America's largest corporations generated record earnings in 2006, thanks to a happy confluence of circumstances. How much longer can the outpouring last? ( more)

Unlike its rivals, the most profitable company in history doesn't much care about alternative fuels and doesn't try to please the greens. Is CEO Rex Tillerson nuts – or shrewd? ( more)
|
| Most profitable companies |
|


