2010
2009
2008
2007
2006
1955-2005
Our annual ranking of America's largest corporations
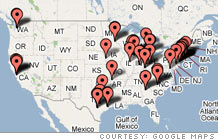
FORTUNE 500 Headquarters
Click to enlarge
Show FORTUNE 500 Companies:
Other lists
This company also appears on other rankings. Most recently:
Revenues
7,778.0
3.0
Profits
766.0
8.3
Assets
7,870.0
—
Stockholders' Equity
1,768.0
—
Market Value 3/23/2007
15,592.2
—
Revenues
9.8
Assets
9.7
Stockholders' equity
43.3
2006 $
1.85
% change from 2005
8.2
1996-2006 annual growth rate %
1.4
2006
33.5
1996-2006 annual rate
2.5
1
PepsiCo
63
35,137.0
2
Sara Lee
125
18,539.0
3
ConAgra Foods
173
14,171.9
4
General Mills
213
11,640.0
5
Kellogg
232
10,906.7
6
Dean Foods
246
10,339.0
7
S&C Holdco 3
268
9,350.0
8
H.J. Heinz
269
9,331.4
9
Campbell Soup
311
7,778.0
10
Land O'Lakes
329
7,102.3
11
Dole Food
367
6,219.3
12
Hormel Foods
403
5,745.5
13
Hershey
453
4,944.2
14
Wm. Wrigley Jr.
472
4,686.0
15
Del Monte Foods
604
3,308.6
16
Interstate Bakeries
646
3,060.5
17
McCormick
692
2,716.4
18
J.M. Smucker
818
2,154.7
19
Flowers Foods
889
1,888.7
20
Ralcorp Holdings
905
1,850.2
From the April 30th, 2007 issue
America's largest corporations generated record earnings in 2006, thanks to a happy confluence of circumstances. How much longer can the outpouring last? (
more )
Unlike its rivals, the most profitable company in history doesn't much care about alternative fuels and doesn't try to please the greens. Is CEO Rex Tillerson nuts � or shrewd? (
more )
Most profitable companies