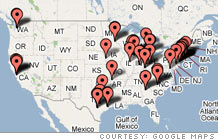
FORTUNE 500 Headquarters

Click to enlarge
Show FORTUNE 500 Companies:
| Revenues |
2,375.9 |
— |
| Profits |
205.0 |
— |
| Assets |
3,465.5 |
— |
| Stockholders' Equity |
1,669.0 |
— |
| Market Value 3/23/2007 |
13,696.9 |
— |
| Revenues |
8.6 |
| Assets |
5.9 |
| Stockholders' equity |
12.3 |
| 2006 $ |
1.36 |
| % change from 2005 |
N.A. |
| 1996-2006 annual growth rate % |
N.A. |
| 2006 |
94.4 |
| 1996-2006 annual rate |
N.A. |
| 1 |
Morgan Stanley
|
20 |
76,688.0 |
| 2 |
Merrill Lynch
|
22 |
70,591.0 |
| 3 |
Goldman Sachs Group
|
24 |
69,353.0 |
| 4 |
Lehman Brothers Holdings
|
47 |
46,709.0 |
| 5 |
Bear Stearns
|
138 |
16,551.4 |
| 6 |
Charles Schwab
|
389 |
5,880.0 |
| 7 |
Franklin Resources
|
445 |
5,050.7 |
| 8 |
E*Trade Financial
|
545 |
3,845.5 |
| 9 |
Legg Mason
|
619 |
3,190.9 |
| 10 |
A.G. Edwards
|
687 |
2,750.8 |
| 11 |
Raymond James Financial
|
712 |
2,632.8 |
| 12 |
NYSE Euronext
|
771 |
2,375.9 |
| 13 |
TD Ameritrade
|
821 |
2,139.4 |
| 14 |
BlackRock
|
831 |
2,098.0 |
| 15 |
Jefferies Group
|
869 |
1,963.2 |
| 16 |
T. Rowe Price
|
914 |
1,819.3 |
| 17 |
Nasdaq Stock Market
|
961 |
1,657.8 |
From the April 30th, 2007 issue

America's largest corporations generated record earnings in 2006, thanks to a happy confluence of circumstances. How much longer can the outpouring last? ( more)

Unlike its rivals, the most profitable company in history doesn't much care about alternative fuels and doesn't try to please the greens. Is CEO Rex Tillerson nuts – or shrewd? ( more)
|
| Most profitable companies |
|