 Get Quote: LOW
Financials: Latest Results
Rank: 47 (Previous rank: 48)
Compare tool: Lowe's vs. Top 10 CEO: Robert A. Niblock Address: 1000 Lowe's Blvd. Mooresville, NC 28117 Phone: 704-758-1000 Website: www.lowes.com Penny-pinching consumers shunned home-improvement retailer Lowe's last year as the housing market and economy continued to collapse. CEO Robert Niblock announced the company would slow its expansion, and delay opening at least 20 stores.
Along with its main competitor, market leader Home Depot, Lowe's has been careful not to let promotions eat away too much at margins. COO Larry Stone says the focus has been on fewer offers that offer higher value. - J.Y. | ||||||||||||||||||||||||||||||||||||||||||||||||||||||||||||||||||||||||||||||||||||||||||||||||||||||||||||||||||||||||||||||||||||||||||||||||||||||||||||||||||||||||||||||||||||||||||||||||||||||||||||||||||||||||||||||||||||||||||||||||||||||||||||||||||||||||||||||||||||||||||||||||||
Industry: Specialty Retailers
|
...Featured Companies
What Readers Say
They speak out on Exxon Mobil and other 500 companies...
| |||||||||||||||||||||||||||||||||||||||||||||||||||||||||||||||||||||||||||||||||||||||||||||||||||||||||||||||||||||||||||||||||||||||||||||||||||||||||||||||||||||||||||||||||||||||||||||||||||||||||||||||||||||||||||||||||||||||||||||||||||||||||||||||||||||||||||||||||||||||||||||||||
Find your top companies
Video
-
 Exxon Mobil shoved aside Wal-Mart to retake the No. 1 slot. But the Fortune 500 had its worst slump ever. Watch
 -
The group harnesses the power of Fortune 500 brand names to fight disease in Africa. Watch
-
Centerpoint, a partner of IBM, No. 14 on the Fortune 500, is using technology to make the power grid smarter. Watch
-
The social network offers companies new ways to reach customers. Will it make the Fortune 500 someday? Watch
-
No. 29 on the Fortune 500, J&J invests for the long term in people and research. Watch
-
 The San Francisco-based bank, No. 41 on the Fortune 500, faces growing pains integrating with Wachovia. Watch
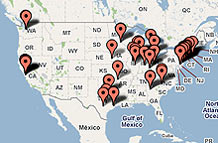
| Rank # of Fortune 500 Companies | |
|---|---|
| Texas | 64 |
| New York | 56 |
| California | 51 |
| Company | Rank |
|---|---|
| Valero Energy | 10 |
| Microsoft | 35 |
| Goldman Sachs | 40 |
| Company | 2008 $ (millions) |
|---|---|
| Exxon Mobil | $45,220.0 |
| Chevron | $23,931.0 |
| Microsoft | $17,681.0 |
FAQ and methodology
Included in the survey are U.S. incorporated companies filing financial statements with a government agency. This includes private companies... More


