|
Rank: 811 (Previous rank: 861)
Compare tool: Applied Biosystems vs. Top 10 CEO: Gregory T. Lucier Address: 301 Merritt 7 Norwalk, CT 06851 Phone: 203-840-2000 Website: www.appliedbiosystems.com | ||||||||||||||||||||||||||||||||||||||||||||||||||||||||||||||||||||||||||||||||||||||||||||||||||||||||||||||||||||||||||
Industry: Medical Products and Equipment
|
What Readers Say
They speak out on Exxon Mobil and other 500 companies...
| |||||||||||||||||||||||||||||||||||||||||||||||||||||||||||||||||||||||||||||||||||||||||||||||||||||||||||||||||||||||||
Find your top companies
Video (1 of 6)
-
 Exxon Mobil shoved aside Wal-Mart to retake the No. 1 slot. But the Fortune 500 had its worst slump ever. Watch
| Rank # of Fortune 500 Companies | |
|---|---|
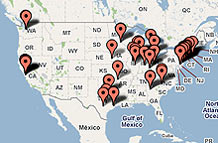
| Texas | 64 |
| New York | 56 |
| California | 51 |
| Company | Rank |
|---|---|
| Valero Energy | 10 |
| Microsoft | 35 |
| Goldman Sachs | 40 |
| Company | 2008 $ (millions) |
|---|---|
| Exxon Mobil | $45,220.0 |
| Chevron | $23,931.0 |
| Microsoft | $17,681.0 |
FAQ and methodology
Included in the survey are U.S. incorporated companies filing financial statements with a government agency. This includes private companies... More


