| Rank |
Company |
Revenues
($ millions) |
Profits
($ millions) |
| 101 |
Staples
|
24,275.5 |
738.7
|
| 102 |
Google
|
23,650.6 |
6,520.4
|
| 103 |
Macy's
|
23,489.0 |
350.0
|
| 104 |
International Paper
|
23,366.0 |
663.0
|
| 105 |
Oracle
|
23,252.0 |
5,593.0
|
| 106 |
3M
|
23,123.0 |
3,193.0
|
| 107 |
Deere
|
23,112.4 |
873.5
|
| 108 |
McDonald's
|
22,744.7 |
4,551.0
|
| 109 |
Tech Data
|
22,099.9 |
180.2
|
| 110 |
Motorola
|
22,063.0 |
-51.0
|
| 111 |
Fluor
|
21,990.3 |
684.9
|
| 112 |
Eli Lilly
|
21,836.0 |
4,328.8
|
| 113 |
Coca-Cola Enterprises
|
21,645.0 |
731.0
|
| 114 |
Bristol-Myers Squibb
|
21,634.0 |
10,612.0
|
| 115 |
Northwestern Mutual
|
21,602.6 |
321.0
|
| 116 |
DirecTV Group
|
21,565.0 |
942.0
|
| 117 |
Emerson Electric
|
20,915.0 |
1,724.0
|
| 118 |
Nationwide
|
20,751.0 |
716.0
|
| 119 |
TJX
|
20,288.4 |
1,213.6
|
| 120 |
AMR
|
19,917.0 |
-1,468.0
|
| 121 |
U.S. Bancorp
|
19,490.0 |
2,205.0
|
| 122 |
GMAC
|
19,403.0 |
-10,298.0
|
| 123 |
PNC Financial Services Group
|
19,231.0 |
2,447.0
|
| 124 |
Nike
|
19,176.1 |
1,486.7
|
| 125 |
Murphy Oil
|
19,138.0 |
837.6
|
| 126 |
Kimberly-Clark
|
19,115.0 |
1,884.0
|
| 127 |
Alcoa
|
18,745.0 |
-1,151.0
|
| 128 |
Plains All American Pipeline
|
18,520.0 |
579.0
|
| 129 |
Cigna
|
18,414.0 |
1,302.0
|
| 130 |
AFLAC
|
18,254.4 |
1,497.0
|
| 131 |
Time Warner Cable
|
17,868.0 |
1,070.0
|
| 132 |
United Services Automobile Association
|
17,557.6 |
3,020.1
|
| 133 |
J.C. Penney
|
17,556.0 |
251.0
|
| 134 |
Exelon
|
17,318.0 |
2,707.0
|
| 135 |
Kohl's
|
17,178.0 |
991.0
|
| 136 |
Whirlpool
|
17,099.0 |
328.0
|
| 137 |
Altria Group
|
16,824.0 |
3,206.0
|
| 138 |
Computer Sciences
|
16,739.9 |
1,115.2
|
| 139 |
Tesoro
|
16,589.0 |
-140.0
|
| 140 |
UAL
|
16,335.0 |
-651.0
|
| 141 |
Goodyear Tire & Rubber
|
16,301.0 |
-375.0
|
| 142 |
Avnet
|
16,229.9 |
-1,122.5
|
| 143 |
Manpower
|
16,038.7 |
-9.2
|
| 144 |
Capital One Financial
|
15,980.1 |
883.8
|
| 145 |
Southern
|
15,743.0 |
1,643.0
|
| 146 |
Health Net
|
15,713.2 |
-49.0
|
| 147 |
FPL Group
|
15,643.0 |
1,615.0
|
| 148 |
L-3 Communications
|
15,615.0 |
901.0
|
| 149 |
Constellation Energy
|
15,598.8 |
4,443.4
|
| 150 |
Occidental Petroleum
|
15,531.0 |
2,915.0
|
| 151 |
Colgate-Palmolive
|
15,327.0 |
2,291.0
|
| 152 |
Xerox
|
15,179.0 |
485.0
|
| 153 |
Dominion Resources
|
15,131.0 |
1,287.0
|
| 154 |
Freeport-McMoRan Copper & Gold
|
15,040.0 |
2,749.0
|
| 155 |
General Mills
|
14,691.3 |
1,304.4
|
| 156 |
AES
|
14,690.0 |
658.0
|
| 157 |
Arrow Electronics
|
14,684.1 |
123.5
|
| 158 |
Halliburton
|
14,675.0 |
1,145.0
|
| 159 |
Amgen
|
14,642.0 |
4,605.0
|
| 160 |
Medtronic
|
14,599.0 |
2,169.0
|
| 161 |
Progressive
|
14,563.6 |
1,057.5
|
| 162 |
Gap
|
14,197.0 |
1,102.0
|
| 163 |
Smithfield Foods
|
14,190.5 |
-190.3
|
| 164 |
Union Pacific
|
14,143.0 |
1,898.0
|
| 165 |
Loews
|
14,123.0 |
564.0
|
| 166 |
EMC
|
14,025.9 |
1,088.1
|
| 167 |
Burlington Northern Santa Fe
|
14,016.0 |
1,721.0
|
| 168 |
Coventry Health Care
|
13,993.3 |
242.3
|
| 169 |
Illinois Tool Works
|
13,903.6 |
947.0
|
| 170 |
Viacom
|
13,619.0 |
1,611.0
|
| 171 |
Toys "R" Us
|
13,568.0 |
312.0
|
| 172 |
American Electric Power
|
13,489.0 |
1,357.0
|
| 173 |
PG&E Corp.
|
13,399.0 |
1,220.0
|
| 174 |
Pepsi Bottling
|
13,219.0 |
612.0
|
| 175 |
Consolidated Edison
|
13,031.6 |
868.2
|
| 176 |
Chubb
|
13,016.0 |
2,183.0
|
| 177 |
CBS
|
13,014.6 |
226.5
|
| 178 |
ConAgra Foods
|
12,980.8 |
978.4
|
| 179 |
FirstEnergy
|
12,967.0 |
1,006.0
|
| 180 |
Sara Lee
|
12,881.0 |
364.0
|
| 181 |
Duke Energy
|
12,731.0 |
1,075.0
|
| 182 |
National Oilwell Varco
|
12,712.0 |
1,469.0
|
| 183 |
Continental Airlines
|
12,586.0 |
-282.0
|
| 184 |
Kellogg
|
12,575.0 |
1,212.0
|
| 185 |
Baxter International
|
12,562.0 |
2,205.0
|
| 186 |
Public Service Enterprise Group
|
12,406.0 |
1,592.0
|
| 187 |
Edison International
|
12,361.0 |
849.0
|
| 188 |
Qwest Communications
|
12,311.0 |
662.0
|
| 189 |
Aramark
|
12,297.9 |
-6.9
|
| 190 |
PPG Industries
|
12,239.0 |
336.0
|
| 191 |
Community Health Systems
|
12,149.7 |
243.2
|
| 192 |
Office Depot
|
12,144.5 |
-596.5
|
| 193 |
KBR
|
12,105.0 |
290.0
|
| 194 |
Eaton
|
11,873.0 |
383.0
|
| 195 |
Dollar General
|
11,796.4 |
339.4
|
| 196 |
Waste Management
|
11,791.0 |
994.0
|
| 197 |
Monsanto
|
11,740.0 |
2,109.0
|
| 198 |
Omnicom Group
|
11,720.7 |
793.0
|
| 199 |
Jabil Circuit
|
11,684.5 |
-1,165.2
|
| 200 |
DISH Network
|
11,664.2 |
635.5
|
|
Interactives
-
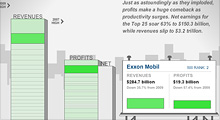
See how revenues and profits at America's 25 largest companies have risen and fallen over the past decade.
-
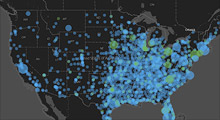
From a single store in 1962 to more than 4,300 outlets today, see how the biggest retailer has expanded.
|


