State
Rank |
Company |
Fortune 500 rank |
City |
Revenues
($ millions) |
| 1 | Exxon Mobil | 2 | Irving | 284,650.0 | | 2 | ConocoPhillips | 6 | Houston | 139,515.0 | | 3 | AT&T | 7 | Dallas | 123,018.0 | | 4 | Valero Energy | 26 | San Antonio | 70,035.0 | | 5 | Dell | 38 | Round Rock | 52,902.0 | | 6 | Marathon Oil | 41 | Houston | 49,403.0 | | 7 | Sysco | 55 | Houston | 36,853.3 | | 8 | Enterprise GP Holdings | 92 | Houston | 25,510.9 | | 9 | Fluor | 111 | Irving | 21,990.3 | | 10 | AMR | 120 | Fort Worth | 19,917.0 | | 11 | Kimberly-Clark | 126 | Irving | 19,115.0 | | 12 | Plains All American Pipeline | 128 | Houston | 18,520.0 | | 13 | United Services Automobile Association | 132 | San Antonio | 17,557.6 | | 14 | J.C. Penney | 133 | Plano | 17,556.0 | | 15 | Tesoro | 139 | San Antonio | 16,589.0 | | 16 | Halliburton | 158 | Houston | 14,675.0 | | 17 | Burlington Northern Santa Fe | 167 | Fort Worth | 14,016.0 | | 18 | National Oilwell Varco | 182 | Houston | 12,712.0 | | 19 | Continental Airlines | 183 | Houston | 12,586.0 | | 20 | KBR | 193 | Houston | 12,105.0 | | 21 | Waste Management | 196 | Houston | 11,791.0 | | 22 | Dean Foods | 208 | Dallas | 11,158.4 | | 23 | Texas Instruments | 223 | Dallas | 10,427.0 | | 24 | Southwest Airlines | 229 | Dallas | 10,350.0 | | 25 | Baker Hughes | 243 | Houston | 9,664.0 | | 26 | Energy Future Holdings | 246 | Dallas | 9,546.0 | | 27 | Tenet Healthcare | 253 | Dallas | 9,215.0 | | 28 | GameStop | 255 | Grapevine | 9,078.0 | | 29 | XTO Energy | 258 | Fort Worth | 9,064.0 | | 30 | Anadarko Petroleum | 260 | The Woodlands | 9,000.0 | | 31 | Apache | 271 | Houston | 8,614.8 | | 32 | CenterPoint Energy | 275 | Houston | 8,281.0 | | 33 | Smith International | 277 | Houston | 8,218.6 | | 34 | Whole Foods Market | 284 | Austin | 8,031.6 | | 35 | Kinder Morgan | 315 | Houston | 7,185.2 | | 36 | Pilgrim's Pride | 317 | Pittsburg | 7,113.8 | | 37 | Commercial Metals | 327 | Irving | 6,883.4 | | 38 | Western Refining | 330 | El Paso | 6,807.4 | | 39 | Calpine | 338 | Houston | 6,564.0 | | 40 | Affiliated Computer Services | 341 | Dallas | 6,523.2 | | 41 | Enbridge Energy Partners | 364 | Houston | 5,905.4 | | 42 | CC Media Holdings | 376 | San Antonio | 5,551.9 | | 43 | Dr Pepper Snapple Group | 378 | Plano | 5,531.0 | | 44 | Energy Transfer Equity | 388 | Dallas | 5,417.3 | | 45 | Cameron International | 399 | Houston | 5,223.2 | | 46 | Celanese | 414 | Dallas | 5,082.0 | | 47 | Atmos Energy | 424 | Dallas | 4,969.1 | | 48 | Holly | 431 | Dallas | 4,834.3 | | 49 | EOG Resources | 434 | Houston | 4,787.0 | | 50 | Spectra Energy | 437 | Houston | 4,725.0 | | 51 | El Paso | 447 | Houston | 4,631.0 | | 52 | Group 1 Automotive | 457 | Houston | 4,525.7 | | 53 | FMC Technologies | 467 | Houston | 4,405.4 | | 54 | Flowserve | 473 | Irving | 4,365.3 | | 55 | RadioShack | 481 | Fort Worth | 4,276.0 | | 56 | Frontier Oil | 488 | Houston | 4,237.2 | | 57 | Blockbuster | 500 | Dallas | 4,161.8 |
|
Interactives
-

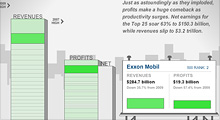
See how revenues and profits at America's 25 largest companies have risen and fallen over the past decade.
-

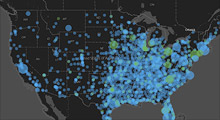
From a single store in 1962 to more than 4,300 outlets today, see how the biggest retailer has expanded.
Pick a state
| State |
# of FORTUNE
500 Companies |
|