| Rank |
Company |
Revenues
($ millions) |
Profits
($ millions) |
| 301 |
C.H. Robinson Worldwide
|
7,577.2 |
360.8
|
| 302 |
Integrys Energy Group
|
7,499.8 |
-70.9
|
| 303 |
Quest Diagnostics
|
7,455.2 |
729.1
|
| 304 |
Western Digital
|
7,453.0 |
470.0
|
| 305 |
Family Dollar Stores
|
7,400.6 |
291.3
|
| 306 |
Winn-Dixie Stores
|
7,367.0 |
39.8
|
| 307 |
Ball
|
7,345.3 |
387.9
|
| 308 |
Est�e Lauder
|
7,323.8 |
218.4
|
| 309 |
Shaw Group
|
7,279.7 |
15.0
|
| 310 |
VF
|
7,220.3 |
461.3
|
| 311 |
Darden Restaurants
|
7,217.5 |
372.2
|
| 312 |
Becton Dickinson
|
7,216.7 |
1,231.6
|
| 313 |
OfficeMax
|
7,212.1 |
0.7
|
| 314 |
Bed Bath & Beyond
|
7,208.3 |
425.1
|
| 315 |
Kinder Morgan
|
7,185.2 |
496.0
|
| 316 |
Ross Stores
|
7,184.2 |
442.8
|
| 317 |
Pilgrim's Pride
|
7,113.8 |
-151.6
|
| 318 |
Hertz Global Holdings
|
7,101.5 |
-126.0
|
| 319 |
Sherwin-Williams
|
7,094.2 |
435.8
|
| 320 |
Ameren
|
7,090.0 |
612.0
|
| 321 |
Reinsurance Group of America
|
7,066.8 |
407.1
|
| 322 |
Owens-Illinois
|
7,066.5 |
161.8
|
| 323 |
CarMax
|
7,028.3 |
59.2
|
| 324 |
Gilead Sciences
|
7,011.4 |
2,635.8
|
| 325 |
Precision Castparts
|
6,913.8 |
1,044.5
|
| 326 |
Visa
|
6,911.0 |
2,353.0
|
| 327 |
Commercial Metals
|
6,883.4 |
20.8
|
| 328 |
WellCare Health Plans
|
6,878.2 |
39.9
|
| 329 |
AutoZone
|
6,816.8 |
657.0
|
| 330 |
Western Refining
|
6,807.4 |
-350.6
|
| 331 |
Dole Food
|
6,782.7 |
84.1
|
| 332 |
Charter Communications
|
6,755.0 |
N.A.
|
| 333 |
Stryker
|
6,723.1 |
1,107.4
|
| 334 |
Goodrich
|
6,685.6 |
597.3
|
| 335 |
Visteon
|
6,685.0 |
128.0
|
| 336 |
NiSource
|
6,652.9 |
217.7
|
| 337 |
AGCO
|
6,630.4 |
135.7
|
| 338 |
Calpine
|
6,564.0 |
149.0
|
| 339 |
Henry Schein
|
6,546.3 |
311.2
|
| 340 |
Hormel Foods
|
6,533.7 |
342.8
|
| 341 |
Affiliated Computer Services
|
6,523.2 |
349.9
|
| 342 |
Thrivent Financial for Lutherans
|
6,514.8 |
-48.4
|
| 343 |
Yahoo
|
6,460.3 |
598.0
|
| 344 |
American Family Insurance Group
|
6,453.4 |
256.9
|
| 345 |
Sonic Automotive
|
6,349.7 |
31.5
|
| 346 |
Peabody Energy
|
6,313.9 |
448.2
|
| 347 |
Omnicare
|
6,242.7 |
211.9
|
| 348 |
Dillard's
|
6,226.6 |
68.5
|
| 349 |
W.W. Grainger
|
6,222.0 |
430.5
|
| 350 |
CMS Energy
|
6,212.0 |
229.0
|
| 351 |
Fortune Brands
|
6,205.4 |
242.8
|
| 352 |
AECOM Technology
|
6,192.4 |
189.7
|
| 353 |
Symantec
|
6,149.9 |
-6,728.9
|
| 354 |
SLM
|
6,144.7 |
324.1
|
| 355 |
DaVita
|
6,108.8 |
422.7
|
| 356 |
KeyCorp
|
6,068.0 |
-1,335.0
|
| 357 |
MeadWestvaco
|
6,049.0 |
225.0
|
| 358 |
Interpublic Group
|
6,027.6 |
121.3
|
| 359 |
Virgin Media
|
6,013.6 |
-559.8
|
| 360 |
MGM Mirage
|
5,978.6 |
-1,291.7
|
| 361 |
First American Corp.
|
5,972.8 |
199.7
|
| 362 |
Avery Dennison
|
5,952.7 |
-746.7
|
| 363 |
McGraw-Hill
|
5,951.8 |
730.5
|
| 364 |
Enbridge Energy Partners
|
5,905.4 |
316.6
|
| 365 |
Ecolab
|
5,900.6 |
417.3
|
| 366 |
Fidelity National Financial
|
5,857.7 |
222.3
|
| 367 |
Dover
|
5,831.0 |
356.4
|
| 368 |
Global Partners
|
5,818.4 |
34.1
|
| 369 |
UGI
|
5,737.8 |
258.5
|
| 370 |
Gannett
|
5,613.0 |
355.3
|
| 371 |
Harris
|
5,599.6 |
37.9
|
| 372 |
Barnes & Noble
|
5,596.3 |
66.7
|
| 373 |
Newell Rubbermaid
|
5,577.6 |
285.5
|
| 374 |
Smurfit-Stone Container
|
5,574.0 |
8.0
|
| 375 |
Pitney Bowes
|
5,569.2 |
423.4
|
| 376 |
CC Media Holdings
|
5,551.9 |
-4,034.1
|
| 377 |
Emcor Group
|
5,547.9 |
160.8
|
| 378 |
Dr Pepper Snapple Group
|
5,531.0 |
555.0
|
| 379 |
Weyerhaeuser
|
5,528.0 |
-545.0
|
| 380 |
SunGard Data Systems
|
5,508.0 |
-1,118.0
|
| 381 |
CH2M Hill
|
5,499.3 |
103.7
|
| 382 |
Pantry
|
5,472.0 |
59.1
|
| 383 |
Domtar
|
5,465.0 |
310.0
|
| 384 |
Clorox
|
5,450.0 |
537.0
|
| 385 |
Northeast Utilities
|
5,439.4 |
330.0
|
| 386 |
Oshkosh
|
5,433.3 |
-1,098.8
|
| 387 |
Mattel
|
5,430.8 |
528.7
|
| 388 |
Energy Transfer Equity
|
5,417.3 |
442.5
|
| 389 |
Advance Auto Parts
|
5,412.6 |
270.4
|
| 390 |
Advanced Micro Devices
|
5,403.0 |
376.0
|
| 391 |
Corning
|
5,395.0 |
2,008.0
|
| 392 |
Mohawk Industries
|
5,344.0 |
-5.5
|
| 393 |
PetSmart
|
5,336.4 |
198.3
|
| 394 |
Reliance Steel & Aluminum
|
5,318.1 |
148.2
|
| 395 |
Hershey
|
5,298.7 |
436.0
|
| 396 |
YRC Worldwide
|
5,282.8 |
-622.0
|
| 397 |
Dollar Tree
|
5,231.2 |
320.5
|
| 398 |
Dana Holding
|
5,228.0 |
-431.0
|
| 399 |
Cameron International
|
5,223.2 |
475.5
|
| 400 |
Nash-Finch
|
5,212.7 |
2.8
|
|
Interactives
-
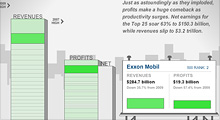
See how revenues and profits at America's 25 largest companies have risen and fallen over the past decade.
-
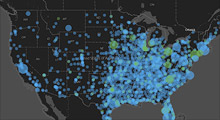
From a single store in 1962 to more than 4,300 outlets today, see how the biggest retailer has expanded.
|


