Our annual ranking of America's largest corporations

8 of 500
BACKNEXT
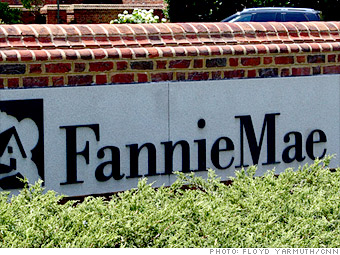
8. Fannie Mae
Fannie Mae
Financials: Latest Results
Rank: 8 (Previous rank: 5)
CEO: Michael J. Williams
Was this company a 2011 top stock?

Last year, Fannie Mae catapulted from No. 81 on the Fortune 500 to No. 5, thanks to new accounting rules. On this year's list, the government-controlled mortgage giant slipped to No. 8 after revenues fell by more than 10% to $137.5 billion. Losses for the year grew to $16.9 billion from $14 billion in 2010.

Fannie Mae continues to be dragged down by its portfolio of loans dating back to the pre-housing crash heyday. The lender has borrowed $116 billion from the government so far, and at the end of last year it sought an additional $4.6 billion to help cover its operating losses. It's difficult to see a turnaround on the horizon.

Subscribe to Fortune Magazine
Key financials $ millions % change
from 2010
Revenues 137,451.0 -10.6
Profits -16,855.0 N.A.
Assets 3,211,484.0
Stockholders' equity -4,624.0
Market value (3/29/2012) 344.5
Profits as % of  
Revenues -12.3
Assets -0.5
Stockholders' equity N.A.
Earnings per share  
2011 $ -4.61
% change from 2010 N.A.
2001-2011 annual growth rate % N.A.
Total return to investors %
2011 -32.9
2001-2011 annual rate -44.0
Rank Company 500
rank
Revenues
($ millions)
1 General Electric 6 147,616.0
2 Fannie Mae 8 137,451.0
3 Freddie Mac 25 88,262.0
4 INTL FCStone 30 75,497.6
5 Marsh & McLennan 231 11,526.0
6 Aon 235 11,287.0
7 Ameriprise Financial 248 10,621.0
8 SLM 426 5,756.0
Issue date: May 21, 2012
Company's senior preferred stock is owned by the U.S. Treasury, which also holds a warrant to purchase 79.9% of the common stock.
Galleries and more
Headquarters
MAPS
Fannie Mae
3900 Wisconsin Ave. N.W.
Washington, DC 20016
202-752-7000
www.fanniemae.com
What do you think about Fannie Mae?
Video
Fortune 500+
Want more on America's top companies? Get data on the full Fortune 1,000 list here. Fortune 500+

Rank # of Fortune 500 Companies
California 53
Texas 52
New York 50
Company Rank
Google 73
NetApp 474
NuStar Energy 377
Company 2011 $ (millions)
Exxon $41,060.0
Chevron $26,895.0
Apple $25,922.0
FAQ and methodology
Included in the survey are U.S. incorporated companies filing financial statements with a government agency. This includes private companies... More
Current Issue
  • Give the gift of Fortune
  • Get the Fortune app
  • Subscribe

Most stock quote data provided by BATS. Market indices are shown in real time, except for the DJIA, which is delayed by two minutes. All times are ET. Disclaimer. Morningstar: © 2018 Morningstar, Inc. All Rights Reserved. Factset: FactSet Research Systems Inc. 2018. All rights reserved. Chicago Mercantile Association: Certain market data is the property of Chicago Mercantile Exchange Inc. and its licensors. All rights reserved. Dow Jones: The Dow Jones branded indices are proprietary to and are calculated, distributed and marketed by DJI Opco, a subsidiary of S&P Dow Jones Indices LLC and have been licensed for use to S&P Opco, LLC and CNN. Standard & Poor's and S&P are registered trademarks of Standard & Poor's Financial Services LLC and Dow Jones is a registered trademark of Dow Jones Trademark Holdings LLC. All content of the Dow Jones branded indices © S&P Dow Jones Indices LLC 2018 and/or its affiliates.