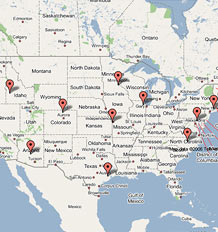
Top 100 finalists
Rank City Population
1 Fort Collins, CO 128,000
2 Naperville, IL 141,600
3 Sugar Land, TX 75,800
4 Columbia/Ellicott City, MD 159,200
5 Cary, NC 106,400
6 Overland Park, KS 164,800
7 Scottsdale, AZ 226,000
8 Boise, ID 193,200
9 Fairfield, CT 57,800
10 Eden Prairie, MN 60,600
11 Plano, TX 250,100
12 Eagan, MN 63,700
13 Olathe, KS 112,100
14 West Bloomfield , MI 65,000
15 Richardson, TX 99,200
16 Gilbert, AZ 178,100
17 Parsippany-Troy Hills, NJ 51,600
18 Santa Clarita, CA 172,500
19 Carrollton, TX 124,700
20 Henderson, NV 232,100
21 Bellevue, WA 117,100
22 Newton, MA 83,200
23 Sandy, UT 89,700
24 Westminster, CO 105,100
25 Ann Arbor, MI 113,300
WINNERS MAP
EMAIL Feedback on the Best Places to Live list?
E-mail the editors
On Board LLC
Information powered by OnBoard LLC
Some data may be provided courtesy of its partners.

Additional data and consulting services provided by Bert Sperling's bestplaces.net.
Top earning cities
  Median household income
Greenwich, CT $112,493
Cupertino, CA $110,518
San Ramon, CA $109,500
See the rest
Hottest cities
  Avg. high temp
in July (°F)
Avondale, AZ 107.6°F
Glendale, AZ 107.6°F
Peoria, AZ 107.6°F
See the rest
Priciest homes
  Median price
Newport Beach, CA $1,362,500
Greenwich, CT $1,129,000
Santa Barbara, CA $979,500
See the rest
Most educated
  % residents with
graduate degrees
Arlington, VA 35.7%
Davis, CA 34.6%
Brookline, MA 32.5%
See the rest
Most singles
  % single residents
Bloomington, IN 58.2%
New Brunswick, NJ 54.6%
College Station, TX 54.3%
See the rest
Youngest
  Median age
Jacksonville, NC 22.90
Provo, UT 23.28
New Brunswick, NJ 24.16
See the rest

Most stock quote data provided by BATS. Market indices are shown in real time, except for the DJIA, which is delayed by two minutes. All times are ET. Disclaimer. Morningstar: © 2018 Morningstar, Inc. All Rights Reserved. Factset: FactSet Research Systems Inc. 2018. All rights reserved. Chicago Mercantile Association: Certain market data is the property of Chicago Mercantile Exchange Inc. and its licensors. All rights reserved. Dow Jones: The Dow Jones branded indices are proprietary to and are calculated, distributed and marketed by DJI Opco, a subsidiary of S&P Dow Jones Indices LLC and have been licensed for use to S&P Opco, LLC and CNN. Standard & Poor's and S&P are registered trademarks of Standard & Poor's Financial Services LLC and Dow Jones is a registered trademark of Dow Jones Trademark Holdings LLC. All content of the Dow Jones branded indices © S&P Dow Jones Indices LLC 2018 and/or its affiliates.

Most stock quote data provided by BATS. Market indices are shown in real time, except for the DJIA, which is delayed by two minutes. All times are ET. Disclaimer. Morningstar: © 2018 Morningstar, Inc. All Rights Reserved. Factset: FactSet Research Systems Inc. 2018. All rights reserved. Chicago Mercantile Association: Certain market data is the property of Chicago Mercantile Exchange Inc. and its licensors. All rights reserved. Dow Jones: The Dow Jones branded indices are proprietary to and are calculated, distributed and marketed by DJI Opco, a subsidiary of S&P Dow Jones Indices LLC and have been licensed for use to S&P Opco, LLC and CNN. Standard & Poor's and S&P are registered trademarks of Standard & Poor's Financial Services LLC and Dow Jones is a registered trademark of Dow Jones Trademark Holdings LLC. All content of the Dow Jones branded indices © S&P Dow Jones Indices LLC 2018 and/or its affiliates.