NEW YORK (CNN/Money) -
With the June employment report coming in well below estimates, stock futures dropped into negative territory Friday morning, despite a slight dip in oil prices after the prior day's runup.
After the payroll report Friday, about an hour before the market open, Nasdaq and S&P futures turned lower.
U.S. employers added 112,000 jobs during the month, less than half the 250,000 new jobs economists had predicted on average. The payroll gain for May was downwardly revised to 235,000 jobs. The unemployment rate remained at 5.6 percent, in line with estimates.
Oil backed away after a sharp gain Thursday on new supply concerns from Russia, Saudi Arabia and Nigeria. U.S. light crude pulled back 5 cents to $38.69 a barrel in electronic before-hours trading, while Brent oil futures slipped 10 cents to $35.97 a barrel in London.
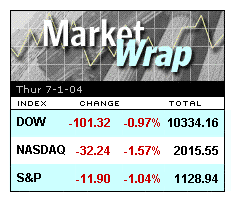
Thursday saw a sharp selloff in stocks amid disappointing economic news, higher oil prices and some key corporate earnings warnings and downgrades. The Dow Jones industrial average fell 1 percent while the Nasdaq composite index tumbled 1.6 percent. (see chart for details)
Going into the week's final session, the Dow is down 37.68 points while the Nasdaq is nearly 10 points lower for the week.
Asian-Pacific stocks retreated on weakness in tech issues, with Tokyo's Nikkei index down 1.5 percent. European markets were lower as midday approached there. (Check the latest on world markets)
Treasury prices rallied strongly after the jobs report. The 10-year note climbed 1-3/32 points in price for a yield of 4.42 percent. The yield had been 4.55 percent earlier in the morning and ended at 4.56 percent late Thursday. The dollar advanced against the yen and euro. Gold lost 70 cents to $395.30 in electronic trading.
In corporate news, the Securities and Exchange Commission sent a letter to about 20 of the largest U.S. telephone and cable operators asking about the methods they use to count their subscriber numbers, according to published reports.

| |
|
For details of Thursday's losses, click above
|
|
The reports follow the admission from Verizon Communications (VZ: Research, Estimates), the largest local phone company, to having reported 1.5 million too many long-distance customers. In an SEC filing it said it had only 16 million long-distance customers at the end of the first quarter.
The Wall Street Journal reported that Comcast (CMCSA: Research, Estimates), the nation's largest cable operator, and Cox Communications (COX: Research, Estimates), the nation's No. 4 cable operator, were among the companies receiving SEC inquiries into its customer counting methods.
Verizon Wireless, a joint venture of Verizon and European telecommunications firm Vodafone Group (VOD: Research, Estimates), announced it was buying the wireless assets of Qwest Communications (Q: Research, Estimates) for $418 million, a move that could help it gain spectrum licenses in 14 states.
Online DVD rental company Netflix reported an 82 percent increase in customers in the second quarter second quarter, which put its subscriber base at the high end of the company's earlier guidance range. But shares of Netflix (NFLX: Research, Estimates) lost $1.16 to $34.79 in after-hours trading following the announcement.

|

