|
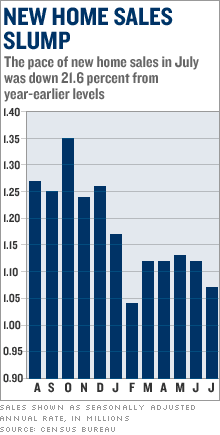
New homes slump worsens Pace of new home sales falls more than forecast as inventory builds, prices decline. NEW YORK (CNNMoney.com) -- More alarm bells for the stumbling housing market rang Thursday, as a government report on new home sales showed a bigger-than-expected drop in sales, along with a continued rise in unsold homes and a further weakening of prices in the closely watched sector. New homes sold at an annual pace of 1.07 million in July, according to the Census Bureau report, down from the 1.12 million pace in June, which was also revised slightly lower than the original reading.
The pace of new home sales is now down 21.6 percent from year-earlier levels, with every region of the country showing double-digit percentage declines compared to July 2005. The drop was worse than the forecast of economists surveyed by Briefing.com, who had estimated new home sales would slip to a 1.11 million pace in the most recent report. The median price of a new home came in at $230,000 in the latest report, essentially flat to the year earlier price levels and down 1.6 percent from the June reading. Median price is the point at which equal numbers of homes sell for more and less. Last year saw rapid increases in prices to record highs, prompting a building boom that helped to create the current oversupply of new homes. The median price is now down 10.5 percent from the record high set in April of this year. "We've got a situation where supply is growing significantly faster than demand," said Paul Kasriel, chief economist for Northern Trust in Chicago. "That means prices are going to need to come down. I think it's going to take at least a couple of years to work out this imbalance, and after that I suspect that the market may go sideways for some time." The supply of new homes completed and available for sale rose to a record 137,000 in July, up 3 percent from the previous record in June and up 33 percent from year-earlier levels. Total homes listed as available for sale, including those permitted but not yet started, stood at 562,000, up 22 percent from a year-earlier level, although it slipped 0.7 percent from the record level seen in June. Still the slower sales pace seen in July led to the government to report a 6.5 month supply of new homes on the market, the largest supply by that measure since November 1995. Impact beyond new homes Home building and new home sales are also closely watched because of how the addition of new supply can shape the market. A much higher percentage than normal of new home purchases in recent year were made by investors, rather than people looking for their own residences. Many of the nation's largest home builders have reported those investors are now trying to sell those homes, flooding the market and driving down all real estate prices. In addition home building has become a key sector of overall U.S. economic activity, accounting for 3 million jobs and 10 percent of the job creation in 2005 during the building boom, according to figures from the Labor Department. The slump in new home sales has resulted in residential builders and contractors trimming 25,000 jobs from their payrolls so far this year, and more job cuts are likely as builders have cut back on building permits and housing starts. Kasriel said the white-hot housing market of recent years has made real estate more important to U.S. economic activity than ever before. Besides the direct impact of people working in construction, real estate and related fields, homeowners have been tapping into home price appreciation through refinancing and home equity lines to help support their spending. That will also be hit if there's a downturn in housing. "Housing has longer tentacles in this expansion than in recent past expansions," he said. "Housing is a bubble, or it was a bubble and it's deflating now. That will have profound impact on the rest of the economy. Whether it causes a recession or not is a question mark, but it has the ability to do so." The drop in new home sales and the weakness in pricing could well be more severe than this report suggests. Builders are reporting that they are offering incentives, such as covering closing costs and additional features on homes at no additional cost. Builders are also reporting a rise in cancel orders for new homes, a drop in sales that would not be captured by this report that counts the number of homes with signed sales contracts. There have been numerous signs of a significant slowdown in the real estate market in recent months from the record pace of both new and existing home sales in 2005. That has raised concerns that the U.S. economy as a whole could cool more than originally expected in the second half of this year. While new home sales are only a fraction of the real estate market as a whole, this is the part of the market that is more closely watched by economists. Since the existing home sales are record at the time the sale is closed, typically months after a contract is signed, the new home sales report that tracks contract signings is a more forward-looking reading. More on the real estate market and what it means for you and the economy |
|


