NEW YORK (CNNMoney.com) -- After a two-day slide in oil prices totaling almost 9 percent, crude moved above the $56 level Friday, confirming predictions made earlier in the day that the selloff was nearly over - at least for now.
Two factors could keep oil from falling lower than the mid-$50s: OPEC production cuts and declining crude supplies.
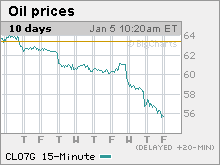 |
| After falling nearly 9 percent in the last two days, U.S. light crude on NYMEX appears to have found a floor of around $55-$56 a barrel. |
Traders are also watching for the return of cold weather to the Northeast United States, the world's largest heating oil market.
Jim Quinn, a NYMEX floor analyst with A.G. Edwards, said one private forecaster predicted temperatures will return to normal by mid-month. But so far the National Weather Service is calling for warm weather through January.
On Friday, Reuters reported that Libya's top oil official, Shokri Ghanem, said OPEC may need to meet in February or March to address the issue.
The comments could be interpreted as a call for a special meeting before OPEC's next regularly scheduled meeting March 15.
Quinn said the comments helped push crude prices, which briefly hit a low of $54.90 overnight, back over the $55 mark.
On Thursday many analysts predicted the fall in crude was nearly over.
"I think we're close to the end of the slide," said Phil Flynn, a senior market analyst at Alaron Trading in Chicago.
The recent decline to around $55 a barrel is the result of several factors, including a relatively stable geopolitical scene and slowing economic growth in the United States.
A big factor is the higher-than-normal temperatures that have sapped demand for heating oil in the Northeast, the world's largest heating oil market.
But at the same time there has been a big drop in crude supplies, as reported by the government each week: Crude stocks fell by 1.3 million barrels this week, 8.1 million last week and 4.3 million the week before.
The declines were initially considered temporary, the result of a thick blanket of fog around the Houston area that prevented ship deliveries. But Flynn notes that supplies have not rebounded. "The channels are [now] open, why didn't we see a big build this week," said Flynn. "We're losing our big supply cushion."
Another reason to suspect the slide is over: OPEC. "Could we see $50 next week? I don't think so," said Adam Sieminski, chief energy economist at Deutsche Bank. "If we get to $55, OPEC will go crazy."
OPEC agreed to cut production by 1.2 million barrels a day Nov. 1, and has agreed to another 500,000 barrel cut slated to begin Feb. 1.
So far about three quarters of the 1.2 million barrel a day cut has been implemented, but OPEC has sometimes had a hard time getting its member nations to actually abide by agreed-to cuts.
The cartel's ability to deliver on its proposed cuts is something traders will be watching during the next several weeks. Failure to deliver could send prices even lower than the mid-$50s.
"By the end of February we could see a number between $50 and $55," said Peter Beutel, an oil analyst at Cameron Hanover, saying that OPEC has a compliance rate of only about 60 percent to 70 percent.
In addition to OPEC doubts, Beutel said demand for gasoline is at its low point for the year and crude inventories could once again climb as firms buy back stocks they sold at the end of the year to avoid paying a tax.
"I'm not convinced there's going to be a slot to shore this market up" he said.
_____________
Energy's winners and losers in 2006
Looking for Iraq's oil windfall 