Treasury rebound continues
Benchmark 10-year yield retreats further from 4% mark as $65 billion in debt sales is absorbed.
 |
| Click on the chart to see other government bond prices and yields. |

NEW YORK (CNNMoney.com) -- Government debt prices rallied Friday, sending yields retreating from recent multi-month highs, with three major auctions safely behind the market.
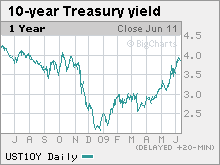
The benchmark 10-year note rose 22/32 to 94-22/32 and its yield fell to 3.78% from 3.86% late Thursday, and 4% earlier in the week. Bond prices and yields move in opposite directions.
The 30-year bond rallied 1-9/32 to 94-4/32 and its yield fell to 4.62%.
The 2-year note ticked up 3/32 to 99-8/32 and its yield fell to 1.28%. The yield on the 3-month dipped to 0.17% from 0.18%.
The Treasury auctioned off $65 billion worth of debt this week. The auctions of 3-year, 10-year and 30-year debt were met with healthy demand. But, the market seems to be caught in a tug-of-war as to how to read the recent run-up in Treasury yields, and the swings in debt prices reflect that debate.
The 4% question: Following Wednesday's $19 billion 10-year sale, the note's yield rose to 4% for the first time since October, spooking Wall Street. The fear was rising yields would signal waning demand for U.S. debt.
The government is on a massive spending campaign to lift the economy out of recession. To do that, Treasury will need to continue auctioning debt. So if demand ebbs, the U.S. could face serious funding issues.
But Thursday's strong 30-year bond sale sent Treasury prices up. Demand has been especially weak in the long end of the curve, so the market was relieved to see solid demand for the longbond.
Reason for optimism: While some analysts read the run-up in debt yields as a sign of disapproval for America's deficit spending, others see it as a vote of confidence for the recovery. Investors tend to dump funds out of the safety of government debt in times of growth, seeking higher returns in other assets such as stocks.
Low Treasury yields may be a boon for mortgage rates - mortgage rates move in tandem with Treasury yields - but they are also an indication of fear in the market. The rebound in Treasury yields is a sign of normalcy returning to the market, according to some analysts.
Libor rates plunge: In another positive read for the credit markets, a closely watched bank-to-bank lending rate has plunged in recent months.
The three-month Libor rate plunged to a record low of 0.62%, down from 0.63% Thursday. The overnight Libor rate sank to 0.21% from 0.26%.
The London Interbank Offered Rate - or Libor - is a daily average of rates that 16 different banks charge each other to lend money. The closely-watched benchmark is used to calculate adjustable-rate mortgages. More than $350 trillion in assets are tied to Libor.
What's the Fed to do?: Investors are waiting to see what the Federal Reserve's next move will be. The next Federal Open Market Committee meeting is June 23 and 24, and the market is already brewing with speculation.
On March 18, the Fed unveiled a $300 billion debt buyback program, also called quantitative easing, in an effort to keep a cap on rising Treasury yields. By stepping into the market and purchasing debt, the Fed bolsters demand and attempts to press yields lower.
The plan worked for a while, as mortgage rates remained low. But the recent runup has affected the housing market -- according to a report released Thursday from Bankrate.com, the average 30-year fixed mortgage rate soared to 5.95% from 5.45% last week. ![]()


