Search News

NEW YORK (CNNMoney) -- Amid a still struggling economy, more people in America fell below the poverty line last year, according to new census data released Tuesday.
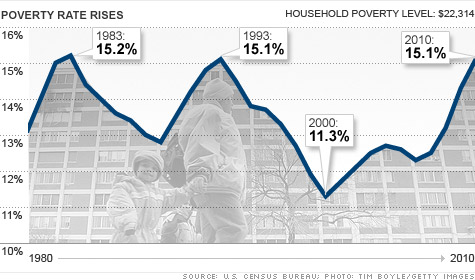
The nation's poverty rate rose to 15.1% in 2010, its highest level since 1993. In 2009, 14.3% of people in America were living in poverty.
"The results are not surprising given the economy," said Paul Osterman, author of "Good Jobs America," and a labor economist at MIT. "You would expect with so many people unemployed, the poverty rate would go up. It's just another sign of what a difficult time this is for so many people."
About 46.2 million people are now considered in poverty, 2.6 million more than last year.
The government defines the poverty line as income of $22,314 a year for a family of four and $11,139 for an individual. The Office of Management and Budget updates the poverty line each year to account for inflation.
Middle-class wealth falls: For middle-class families, income fell in 2010. The median household income was $49,445, down slightly from $49,777 the year before.
Median income has changed very little over the last 30 years. Adjusted for inflation, the middle-income family only earned 11% more in 2010 than they did in 1980, while the richest 5% in America saw their incomes surge 42%.
"Over that period of time, it's not that the American economy has necessarily performed badly," Osterman said. "As a country we're richer over that period, but there's been this real shift in where the income has gone, and it's to the top."
Amplifying that trend, the bottom 60% of households saw their income fall last year, while households making $100,000 or more enjoyed a rise in income.
More children in poverty: The poverty rate for children under age 18 increased to 22% in 2010, meaning more than 1 in 5 children in America are living in poverty.
Meanwhile, the poverty rate for adults ages 18 to 64 rose to 13.7%.
For people 65 and older, the poverty rate was barely changed at 9%.
Following the recession, fewer young adults are moving out of their parents' homes. Last year, 5.9 million young adults age 25 to 34 still lived with their folks, compared with 4.7 million before the recession.
Race and gender factors: By race, the poverty rate was lowest for non-Hispanic whites at 9.9%.
Blacks had the highest rate at 27.4%, followed by people of Hispanic origin at 26.6%. Asians had a poverty rate of 12.1%.
About 14% of men were below the poverty line, compared to 16.2% of women.
Families headed by a married couple had only a 6.2% poverty rate, whereas families with a single mother had a 31.6% rate, and families with a single father had a 15.8% rate.
South hit the hardest: For the fifth year in a row, Mississippi households were the poorest in the country, this time with a median income of $37,985. New Hampshire households had the highest median income, at $66,707.
Among different regions of the country, the South had the highest poverty rate at 16.9%, while the Northeast had the lowest rate at 12.8%.
The poverty rate was 13.9% in the Midwest and 15.3% in the West.
The income used to calculate poverty status includes earnings, workman's compensation, unemployment insurance, Social Security, veteran's payments, pensions, interest and dividends, and just about every other source of cash.
It does not, however, include capital gains, so, theoretically, millionaires could qualify as poor if they lived solely by selling off investments.
Non-cash benefits, such as food stamps or subsidized rents, also do not count as income.
More people are uninsured: The census report also contained data on health insurance, showing people lacking medical benefits climbed to 49.9 million last year, up from 49 million in 2009.
Overall, about 16.3% of people in America were uninsured in 2010, statistically unchanged from 2009.
Are you living below the poverty level and depending on government assistance? Send an email to realstories@cnnmoney.comand you could be profiled in an upcoming piece on CNNMoney. For the CNNMoney Comment Policy, click here. ![]()
| Overnight Avg Rate | Latest | Change | Last Week |
|---|---|---|---|
| 30 yr fixed | 3.80% | 3.88% | |
| 15 yr fixed | 3.20% | 3.23% | |
| 5/1 ARM | 3.84% | 3.88% | |
| 30 yr refi | 3.82% | 3.93% | |
| 15 yr refi | 3.20% | 3.23% |
Today's featured rates:
| Latest Report | Next Update |
|---|---|
| Home prices | Aug 28 |
| Consumer confidence | Aug 28 |
| GDP | Aug 29 |
| Manufacturing (ISM) | Sept 4 |
| Jobs | Sept 7 |
| Inflation (CPI) | Sept 14 |
| Retail sales | Sept 14 |