Gas prices fell 6.8% in May, driving overall inflation lower during the month, the government reported Thursday.
NEW YORK (CNNMoney) -- Consumers felt some relief at the gas pump in May, as falling prices slowed overall inflation during the month.
The government's key measure of inflation, the Consumer Price Index, showed consumer prices fell 0.3% in May, the deepest monthly drop since December 2008.
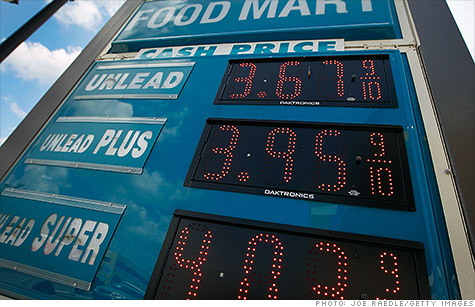
Declining gas prices were the biggest factor, plunging 6.8%. Gasoline started the month off at a national average of $3.81 a gallon and fell to $3.62 by the end of May, according to separate data from the Oil Price Information Service.
Lower gas prices are a welcome sign for consumers and can often act as a small economic stimulus, because consumers have more money to spend on other goods. But swings in gas prices typically take a few months to trickle through to prices on other goods and affect consumer behavior.
Food prices, for example, were unchanged in May.
Meanwhile, a separate report released Wednesday showed retail sales declined in May, mostly because consumers spent nearly $1 billion less at gas stations. Excluding gas, food and autos, retail sales were still down for the second month in a row.
While the decline in retail sales has been disappointing, some economists expect it to be merely temporary. Lower gas prices could boost spending later in the summer, said Ian Shepherdson, chief U.S. economist for High Frequency Economics, in a note to clients.
"Gas prices have plunged over the last two months and are still falling fast, so allowing for the lag, we hope to see much stronger spending in July and August, and beyond," Shepherdson said.
Stripping out gas and food, so-called core inflation rose 0.2% from month to month.
Over the last year, Americans have seen a 1.7% inflation rate. Core inflation is up 2.3% year-over-year, slightly above the Federal Reserve's target for a 2% rate.
The Consumer Price Index measures price changes on a broad basket of consumer goods, including food, energy, housing, cars, apparel and medical expenses. ![]()
| Overnight Avg Rate | Latest | Change | Last Week |
|---|---|---|---|
| 30 yr fixed | 3.80% | 3.88% | |
| 15 yr fixed | 3.20% | 3.23% | |
| 5/1 ARM | 3.84% | 3.88% | |
| 30 yr refi | 3.82% | 3.93% | |
| 15 yr refi | 3.20% | 3.23% |
Today's featured rates:
| Latest Report | Next Update |
|---|---|
| Home prices | Aug 28 |
| Consumer confidence | Aug 28 |
| GDP | Aug 29 |
| Manufacturing (ISM) | Sept 4 |
| Jobs | Sept 7 |
| Inflation (CPI) | Sept 14 |
| Retail sales | Sept 14 |


