Search News

NEW YORK (CNNMoney) -- Americans' net worth collapsed in recent years, but don't blame the housing market for it all.
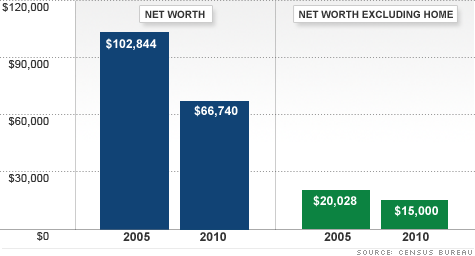
A CNNMoney analysis of new Census Bureau data shows that if you strip out the effects of the housing collapse, median household net worth still fell by 25% between 2005 and 2010. The decline was driven largely by the plummeting stock market, which devastated Americans' portfolios and retirement accounts.
Overall, median household net worth declined 35% to $66,740 in 2010.
The median worth of stock and mutual fund portfolios fell 33%, while the median home equity value dropped 28%.
"One of the significant factors is housing, of course, but it's not that alone" said Alfred Gottschalck, an economist with the Census Bureau. "It's how business conditions affect stock and retirement accounts."
The estimates are generally in line with what other government reports have found. Last week, the Federal Reserve released its triennial study that showed median family net worth overall dropped nearly 40%, between 2007 and 2010. The Fed surveys a smaller number of people.
But unlike the Fed study, the Census Bureau also looks at wealth changes excluding home equity. So it provides a clearer look at other factors affecting net worth.
The Great Recession -- including the housing and stock market collapses -- wiped out nearly 30 years of net worth gains for the typical household.
"The median household is no wealthier than they were in 1984," said Scott Winship, economic studies fellow at Brookings Institution.
Digging deeper into the data shows that some groups of Americans were hit much harder than others.
Asian, black and Hispanic households each lost a much greater share of median net worth, around 60%, than their white counterparts, at 30%.
As for median home equity values, Hispanic households experienced a 55% drop, while Asians saw a 43% decline and blacks a 35% decrease. Whites, on the other hand, lost just under a quarter.
Age was also a factor, with younger Americans losing a greater share of their wealth than their parents' generation.
Households of people age 35 to 44 saw the largest percent decline in median net worth of any age group: 59%. If home equity isn't factored in, they lost 40%.
Senior citizen households, who have a more diversified portfolio of assets, fared better. They lost only 13% of their net worth, and 18% if home values aren't included.
The glimmer of good news in the report is that net worth was steadier between 2009 and 2010, according to Census figures. Overall, it decreased only 4% and, if home equity is excluded, it rose 8%.
"You see some degree of stability, but no real recovery in wealth," said Rakesh Kochhar, co-author of the Pew Research Center report on wealth. ![]()
| Overnight Avg Rate | Latest | Change | Last Week |
|---|---|---|---|
| 30 yr fixed | 3.80% | 3.88% | |
| 15 yr fixed | 3.20% | 3.23% | |
| 5/1 ARM | 3.84% | 3.88% | |
| 30 yr refi | 3.82% | 3.93% | |
| 15 yr refi | 3.20% | 3.23% |
Today's featured rates:
| Latest Report | Next Update |
|---|---|
| Home prices | Aug 28 |
| Consumer confidence | Aug 28 |
| GDP | Aug 29 |
| Manufacturing (ISM) | Sept 4 |
| Jobs | Sept 7 |
| Inflation (CPI) | Sept 14 |
| Retail sales | Sept 14 |