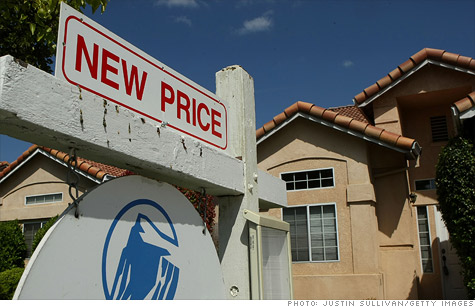
Home prices nationwide have hit a bottom, and home values are finally on the rise.
NEW YORK (CNNMoney) -- Home prices hit a bottom and are finally bouncing back, according to an industry report released Tuesday.
Nationwide, home values rose 0.2% year-over-year to a median $149,300 during the second quarter, the first annual increase since 2007, real estate listing site Zillow reported. Prices were up 2.1% from the first quarter.
Even though June marked the fourth consecutive month of home value increases, overall home prices are still down almost 24% since April 2007, when Zillow began to track home values.
"[I]t seems clear that the country has hit a bottom in home values," said Zillow's chief economist Stan Humphries. "The housing recovery is holding together despite lower-than-expected job growth, indicating that it has some organic strength of its own."
Last winter, Zillow projected that the housing market turnaround would not arrive until the end of the year.
Other home price indexes have also recorded gains lately, including the S&P/Case-Shiller home price index. In it latest release, it reported that home prices in 20 major markets rose 1.3% in April, the first monthly increase in seven months.
Zillow uses a different methodology in calculating home values than other home price indexes like Case-Shiller and the Federal Housing Finance Agency. Sales of foreclosed, bank-owned properties, for example, are not factored into Zillow's data. Zillow does include short sales, however, which are more difficult to distinguish from conventional sales.
"Our index is geared to consumers, conventional sellers deciding whether they want to put their homes on the market," said Humphries.
The indexes that include foreclosures in their market data show larger price declines. The peak-to-trough drop for the S&P/Case-Shiller home price index, for example, is about 34% compared with Zillow's 24%.
Fewer than one third of the 167 metro areas Zillow surveyed recorded annual increases in home values, but the size of the price gains in these areas more than offset the losses posted by the remaining two-thirds of the markets.
In Phoenix, the biggest gainer, home values soared 12.1% year-over-year to a median of $136,200. Meanwhile, the biggest loss sustained by any of the 30 largest metro areas was in Chicago where median home values fell 5.8% to $158,600.
Foreclosures remain one of the biggest risks to the housing market recovery, Humphries said. In the wake of the national foreclosure settlement which clarified how banks can legally pursue foreclosures, Humphries expects the pace of foreclosures to pick up.
"That will translate to more homes on the market," he said. "But we think demand will rise to absorb that."
Zillow expects the housing market to continue to slowly recover, with median home values projected to climb 1.1% -- relatively flat -- over the next 12 months.
Beaten down markets like Phoenix, Las Vegas and many Florida cities, will likely record greater-than-average gains over the next 12 months, said Humphries.
The results in those places, however, will be bumpy. Home price increases will cause some homeowners who have been patiently waiting for values to rebound to put their homes on the market. And those additional listings could cool prices for a while, resulting in a staircase effect with "price spikes followed by plateaus," said Humphries. ![]()
| Overnight Avg Rate | Latest | Change | Last Week |
|---|---|---|---|
| 30 yr fixed | 3.80% | 3.88% | |
| 15 yr fixed | 3.20% | 3.23% | |
| 5/1 ARM | 3.84% | 3.88% | |
| 30 yr refi | 3.82% | 3.93% | |
| 15 yr refi | 3.20% | 3.23% |
Today's featured rates: