9 of 10
BACKNEXT
Los Angeles Calif: 4th least affordable metro area
Los Angeles Calif.
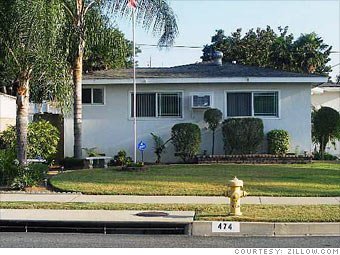
$319,900: A 3-bed, 2-bath California ranch on a small lot.
See More Views:
1 2 3
Median home price: $319,000
Median income:$59,800
Affordability score: 26.9%

The second largest metropolitan area in the country is the fourth least affordable, but home prices are improving -- a lot. They have plummeted from a high of $530,000 during the second quarter of 2007 to their current median of $319,000, according to the NAHB-Wells Fargo Housing Opportunity Index. That's an almost 40% drop.

Despite the huge price decline, only about 26.9% of the homes sold during the last three months of 2008 were affordable to those earning the median family income of $59,800. That is a huge improvement compared with late 2006, however, when barely 2% of the homes sold were affordable to the average buyer.

Meanwhile, foreclosures have become a major headache. There were nearly 97,000 properties receiving foreclosure filings last year in the LA metro area, more than double the total of 2007, and the 26th highest rate of any metro area, according to RealtyTrac.

With job losses expanding -- the unemployment rate for the area is up to 8.8% - foreclosure losses will probably continue to increase. That would put more downward pressure on prices and lead to increased housing affordability in the future.

NEXT: Miami Fla: 5th least affordable metro area
Last updated February 26 2009: 12:46 PM ET
More Galleries
10 of the most luxurious airline amenity kits When it comes to in-flight pampering, the amenity kits offered by these 10 airlines are the ultimate in luxury More
7 startups that want to improve your mental health From a text therapy platform to apps that push you reminders to breathe, these self-care startups offer help on a daily basis or in times of need. More
5 radical technologies that will change how you get to work From Uber's flying cars to the Hyperloop, these are some of the neatest transportation concepts in the works today. More

Special Offer

Most stock quote data provided by BATS. Market indices are shown in real time, except for the DJIA, which is delayed by two minutes. All times are ET. Disclaimer. Morningstar: © 2018 Morningstar, Inc. All Rights Reserved. Factset: FactSet Research Systems Inc. 2018. All rights reserved. Chicago Mercantile Association: Certain market data is the property of Chicago Mercantile Exchange Inc. and its licensors. All rights reserved. Dow Jones: The Dow Jones branded indices are proprietary to and are calculated, distributed and marketed by DJI Opco, a subsidiary of S&P Dow Jones Indices LLC and have been licensed for use to S&P Opco, LLC and CNN. Standard & Poor's and S&P are registered trademarks of Standard & Poor's Financial Services LLC and Dow Jones is a registered trademark of Dow Jones Trademark Holdings LLC. All content of the Dow Jones branded indices © S&P Dow Jones Indices LLC 2018 and/or its affiliates.