Companies
Markets
Tech
Billy
companies
News
Economy
Your Money, Your America
Davos
markets
premarkets
dow 30
After-Hours
market movers
fear & greed
world markets
investing
markets now
before the bell
romans' numeral
Quest's Profitable Moment
tech
Pacific
Work Transformed
Living in the Future
Innovate
Our Driverless Future
Tech Business
Culture
Future
Startups
personal finance
Money Essentials
New Rules for Retirement
Money Moves
Calculators
Finance Center
Billy Jean
Success
Boss Files
Fresh Money
Entrepreneurs
My American Success Story
More...
SURGE
Newsletters
Alerts: Sign up/Manage
Interactives
Contact Us
Closed Captioning
Follow us:
Search News
Symbol Matches
Symbol Starts With
Company Matches
U.S.
International
Switzerland
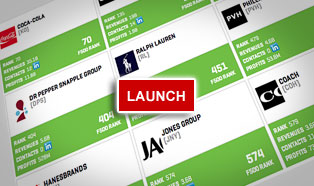
FORTUNE 500
Our annual ranking of America's largest corporations
2013
2012
2011
2010
2009
2008
2007
2006
1955-2005
Full List
Near You
CEOs
Top Companies
Industries
Fortune 500
Companies
Fastest growers
Most profitable
Biggest
Top companies: Most profitable
Profits
Return on Revenues
Return on Shareholders' Equity
Rank
▾
Company
500 Rank
2011 Profits as % of Revenues
1
Devon Energy
232
40.9
2
MGM Resorts International
331
39.7
2
Visa
281
39.7
4
Corning
328
35.6
5
Gilead Sciences
306
33.4
6
Microsoft
37
33.1
7
Qualcomm
178
28.5
8
MasterCard
370
28.4
9
Occidental Petroleum
122
28.0
10
eBay
228
27.7
11
Philip Morris International
99
27.6
12
Celgene
492
27.2
13
Apache
154
27.1
14
Franklin Resources
353
26.9
15
Discover Financial Services
300
26.0
16
BlackRock
283
25.7
16
Google
73
25.7
18
Mosaic
268
25.3
19
CF Industries Holdings
402
25.2
20
American International Group
33
24.8
21
Biogen Idec
476
24.5
22
Oracle
82
24.0
22
Intel
51
24.0
24
Apple
17
23.9
25
Cliffs Natural Resources
366
23.8
26
Amgen
168
23.6
27
U.S. Bancorp
132
22.8
28
Freeport-McMoRan Copper & Gold
135
21.8
29
Western Union
445
21.2
30
Spectra Energy
438
21.1
31
Yahoo
483
21.0
32
Altria Group
156
20.4
32
McDonald's
107
20.4
34
Fifth Third Bancorp
372
19.4
34
Medtronic
164
19.4
36
Marathon Oil
173
19.3
36
PNC Financial Services Group
165
19.3
38
KeyCorp
499
19.2
39
State Street Corp.
262
18.8
40
Coca-Cola
59
18.4
41
Applied Materials
251
18.3
42
Wells Fargo
26
18.1
43
Eli Lilly
119
17.9
44
Charles Schwab
485
17.7
45
Bristol-Myers Squibb
134
17.5
46
SanDisk
430
17.4
47
Allergan
448
17.2
47
Norfolk Southern
241
17.2
49
J.P. Morgan Chase & Co.
16
17.1
50
Capital One Financial
148
17.0
Issue date: May 21, 2012
20 most profitable
These companies made the most
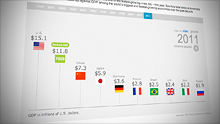
If the 500 were a country...
Where would it stack up in the global economy?
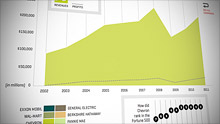
A time-lapse recap of the Fortune 10
Charting a decade of revenue peaks � and valleys � for 2012's top 10 companies in America.
Galleries and more
Career advice from women CEOs
Female Fortune 500 execs share their secrets to success
See them all
Fortune 500 freshmen
New arrivals (and some returnees) to the list
See them all
Before they were famous, they worked WHERE?
Ashton Kutcher, Ellen DeGeneres and more got their start at a Fortune 500 company
See them all
Fortune 500 social media superstars
McDonalds, JetBlue and Nike are among the companies worth following online
See them all
Video
Buffett: Obama beats Romney on economy
Warren Buffett talks about Romney vs. Obama, Europe, and Facebook at Berkshire Hathaway's annual meeting in Omaha.
Watch
Why Microsoft hires war vets
Like many other large companies, Microsoft has a special program to recruit military veterans.
Watch
How the iPhone saved a Corning factory
Steve Jobs' request for tougher glass in the iPhone led Corning to produce Gorilla Glass at a previously struggling Kentucky factory.
Watch
Fortune 500+
Want more on America's top companies? Get data on the full Fortune 1,000 list here.
Top 3
HOW STATES
STACK UP
BEST
EMPLOYERS
MOST
PROFITABLE
Rank
# of Fortune 500 Companies
California
53
Texas
52
New York
50
See the rest
Company
Rank
Google
73
NetApp
474
NuStar Energy
377
See the rest
Company
2011 $ (millions)
Exxon
$41,060.0
Chevron
$26,895.0
Apple
$25,922.0
See the rest
FAQ and methodology
Included in the survey are U.S. incorporated companies filing financial statements with a government agency. This includes private companies...
More
Current Issue
100 Best Companies to Work For
Give the gift of Fortune
Get the Fortune app
Subscribe