FSB 100
|
Video
-


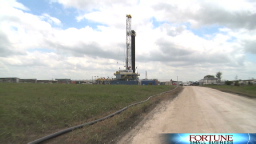 Carrizo Oil and Gas' 3-D seismic surveys reveal a wealth of natural gas and oil in the North Texas Barnett Shale. Watch
 -

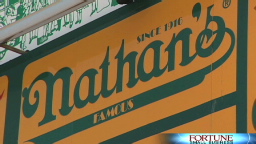 N.Y.'s legendary Nathan's Famous is dramatically increasing revenues and profit by expanding nationwide sales of its famous hot dogs. Watch
 -
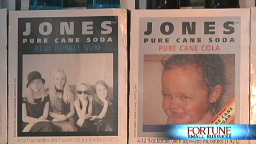 The ups and downs of Jones Soda, the alternative beverage company with a new CEO and a new business strategy. Watch


Top 3
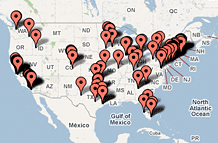
| State | # of FSB 100 Companies |
|---|---|
| California | 18 |
| Texas | 12 |
| New York | 11 |
| Executive | Total Ownership Value ($ millions) |
|---|---|
| T. Kendall Hunt | 266.2 |
| Donald E. Brown, M.D. | 116.4 |
| George A. Lopez, M.D. | 103.5 |
| Company | Revenue growth (3-yr. annualized) |
|---|---|
| Arena Resources | 132.7% |
| Smith Micro Software | 97.8% |
| TGC Industries | 74.0% |
All companies that meet these criteria are ranked, 1-100, by their three-year annualized rates of revenue growth, EPS growth, and total return to investors... More