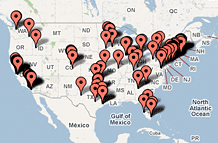
• Top 100
  • Companies
  • Industries
  • States
  • Cities
  • All
  • Richest Executives
  • Revenue Growth
  • EPS Growth
  • Stock performance
  • Revenue
  • Net income
  • Employees
FSB 100
Rank Company EPS growth* Revenue growth* Total return to investors*
1 Astronics 201.4% 65.5% 102.7%
2 Arena Resources 97.2% 132.7% 114.1%
3 Bolt Technology 148.6% 57.3% 96.6%
4 North American Galvanizing & Coatings 276.2% 40.2% 63.6%
5 Vasco Data Security International 90.2% 67.9% 61.6%
6 Dynamic Materials 82.4% 44.1% 113.6%
7 Life Partners Holdings 99.6% 45.2% 72.1%
8 AeroCentury 143.5% 30.6% 108.2%
9 Gulfport Energy 55.1% 71.2% 76.9%
10 Interactive Intelligence 152.3% 26.2% 80.2%
11 The Knot 135.3% 35.0% 46.7%
12 Thomas Group 85.7% 28.2% 79.9%
13 Concur Technologies 75.4% 34.2% 59.6%
14 OYO Geospace 81.9% 32.5% 59.1%
15 Amerigon 84.4% 27.2% 78.1%
16 Rochester Medical 241.0% 32.7% 33.4%
17 Parallel Petroleum 49.6% 52.6% 48.4%
18 Kreisler Manufacturing 169.9% 27.4% 39.9%
19 Ultimate Software 208.2% 28.2% 35.4%
20 Mitcham Industries 50.8% 45.6% 45.3%
21 LMI Aerospace 97.2% 21.8% 69.9%
22 IntriCon 70.5% 23.2% 82.3%
23 Ebix 56.3% 26.9% 69.6%
24 Logility 101.9% 26.9% 38.3%
25 Bitstream 157.2% 26.4% 34.2%
26 Natus Medical 45.3% 54.1% 34.2%
27 TGC Industries 22.1% 74.0% 53.5%
28 Edgewater Technology 136.5% 41.6% 14.2%
29 CyberSource 38.4% 42.1% 35.5%
30 Pericom Semiconductor 203.3% 23.1% 25.6%
31 GeoResources 23.3% 44.9% 43.3%
32 Atlantic Tele-Network 34.2% 33.7% 40.6%
33 Spectranetics 33.4% 35.1% 39.7%
34 Fuel Tech 16.1% 35.6% 69.3%
35 Health Grades 44.6% 37.3% 27.1%
36 Mercer Insurance Group 66.3% 50.0% 10.5%
37 Actuate 106.2% 11.5% 45.0%
38 Phase Forward 51.1% 22.5% 38.6%
39 American Physicians Service Group 56.7% 28.0% 24.5%
40 Sun Hydraulics 37.6% 21.2% 54.7%
41 Carrizo Oil & Gas 8.7% 31.4% 69.2%
42 Bankrate 3.7% 38.4% 51.4%
43 WSI Industries 73.6% 14.8% 37.8%
44 United States Lime & Minerals 21.6% 34.7% 38.8%
45 ICU Medical 57.9% 37.2% 9.6%
46 TradeStation Group 38.5% 29.9% 26.4%
47 Medifast 40.7% 50.5% 11.3%
48 Trio-Tech International 93.1% 19.7% 22.6%
49 Lifeway Foods 26.0% 30.0% 37.3%
50 Stamps.com 73.2% 35.9% -8.4%
51 Palomar Medical Technologies 58.3% 40.3% -16.2%
52 Quality Systems 37.3% 26.6% 28.8%
53 PrimeEnergy 17.9% 29.1% 39.2%
54 Versar 89.3% 22.0% 14.7%
55 A.D.A.M. 0.1% 51.3% 28.1%
56 Synalloy 104.3% 15.8% 20.4%
57 Art's-Way Manufacturing 12.2% 26.7% 53.1%
58 Chyron 44.6% 9.5% 55.8%
59 Almost Family 56.5% 11.0% 38.2%
60 Balchem 21.5% 30.9% 30.0%
61 American Science and Engineering 66.6% 26.2% 11.3%
62 Mesa Laboratories 27.6% 27.8% 28.1%
63 American Ecology -4.2% 47.2% 27.1%
64 Chase Corp. 32.4% 16.1% 49.6%
65 Meridian Bioscience 35.6% 16.2% 39.7%
66 NetScout Systems 74.5% 13.4% 22.3%
67 Globecomm Systems 51.4% 20.1% 22.3%
68 PeopleSupport 23.0% 53.7% 11.1%
69 Pioneer Behavioral Health 45.4% 17.3% 27.7%
70 HMS Holdings 14.8% 20.9% 54.5%
71 Learning Tree 201.8% 3.7% 19.7%
72 KMG Chemicals 36.5% 24.6% 24.4%
73 Willis Lease 50.1% 24.0% 17.2%
74 Spectrum Control 38.0% 18.9% 28.3%
75 UFP Technologies 71.4% 11.7% 24.7%
76 Jones Soda 36.7% 19.0% 29.2%
77 LivePerson 15.4% 43.7% 19.2%
78 Medtox Scientific 56.7% 12.1% 26.2%
79 Supertex 56.1% 21.1% 13.0%
80 Iris International 29.0% 23.3% 26.3%
81 Asta Funding 32.8% 40.9% 0.3%
82 Edac Technologies 2.2% 14.2% 80.3%
83 NetLogic Microsystems 10.2% 19.4% 47.7%
84 Elecsys 51.2% 24.3% 8.6%
85 Smith Micro Software 16.7% 97.8% -1.8%
86 Transcat 61.6% 8.5% 25.5%
87 Eastern Co. 50.8% 20.4% 13.2%
88 Nathan's Famous 37.1% 13.3% 32.4%
89 Royal Gold 17.2% 31.1% 19.7%
90 Nobel Learning Communities 68.2% 6.7% 24.1%
91 Gencor Industries 70.0% 17.4% 6.9%
92 American Medical Alert 39.0% 25.7% 10.4%
93 Abaxis -1.5% 24.7% 35.3%
94 Somanetics -3.9% 42.2% 15.4%
95 Tessera Technologies 6.0% 51.7% 3.8%
96 Key Technology 17.2% 11.8% 52.7%
97 Atrion 25.2% 10.9% 40.7%
98 CAM Commerce Solutions 31.9% 10.7% 37.1%
99 IntegraMed America 46.5% 8.7% 25.9%
100 Nortech Systems 54.0% 19.1% 4.6%
From the July/August 2008 issue of Fortune Small Business
*Three-year annualized rate

Video (1 of 3)
Top 3

California 18
Texas 12
New York 11
T. Kendall Hunt 266.2
Donald E. Brown, M.D. 116.4
George A. Lopez, M.D. 103.5
Arena Resources 132.7%
Smith Micro Software 97.8%
TGC Industries 74.0%
All companies that meet these criteria are ranked, 1-100, by their three-year annualized rates of revenue growth, EPS growth, and total return to investors... More

Most stock quote data provided by BATS. Market indices are shown in real time, except for the DJIA, which is delayed by two minutes. All times are ET. Disclaimer. Morningstar: © 2018 Morningstar, Inc. All Rights Reserved. Factset: FactSet Research Systems Inc. 2018. All rights reserved. Chicago Mercantile Association: Certain market data is the property of Chicago Mercantile Exchange Inc. and its licensors. All rights reserved. Dow Jones: The Dow Jones branded indices are proprietary to and are calculated, distributed and marketed by DJI Opco, a subsidiary of S&P Dow Jones Indices LLC and have been licensed for use to S&P Opco, LLC and CNN. Standard & Poor's and S&P are registered trademarks of Standard & Poor's Financial Services LLC and Dow Jones is a registered trademark of Dow Jones Trademark Holdings LLC. All content of the Dow Jones branded indices © S&P Dow Jones Indices LLC 2018 and/or its affiliates.