NEW YORK (CNN/Money) -
Like it or not, Google is about to become a contestant in the latest edition of Wall Street's whisper number game.
The company, due to report earnings on Thursday, vowed during its IPO process this summer that it would not issue quarterly earnings guidance to Wall Street and that it would not manage its business to satisfy short-term expectations.
That's incredibly noble. Too bad it probably won't work.
Even though the company is widely expected to report a blockbuster quarter, Wall Street has already begun to talk about how much Google will need to beat estimates by.
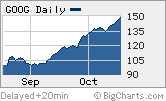
After all, Google's stock has surged more than 75 percent from its offering price. (Who said dot-com euphoria was dead?)
"We're expecting a very strong quarter. The question is will it be good enough to keep the stock going?" said Youssef Squali, an analyst with Jefferies & Co.
So with that in mind, here are some key things investors should look out for in the report and conference call:
Too much earnings confusion
You might be surprised to learn that Google's actual bottom line will be negative.
What? Isn't Google supposed to be extremely profitable? Yes. But Google agreed to pay arch rival Yahoo! about $300 million in Google stock in August to settle a patent lawsuit and that charge will result in a loss.
 |
|
| Google has a lot to live up to when it reports its first results since its IPO. |
Analysts, however, are not including this charge or the cost of stock-based compensation. The consensus estimate for the quarter is for a pro-forma profit of 54 cents per share.
So Google investors are going to have to seek out the pro-forma earnings number to find out whether Google met, beat or missed its numbers.
"It's going to be hard to judge Google's quarterly numbers from the first headlines. There is going to be some confusion," said Mark Mahaney, an analyst with American Technology Research.
A TAC-tful approach to sales
The earnings number won't be the only source of bemusement.
The consensus sales estimate is $454 million. But the reported revenue figure is likely to be much higher because it does not take into account traffic acquisition costs, or TAC. These are the search-related revenues that companies like Google and Yahoo! share with partners.
Analysts exclude TAC to see how much revenue the search companies are actually keeping.
In the second quarter, Google reported total gross revenues of more than $700 million. Excluding TAC, sales were $423.2 million.
Better than Yahoo?
If Google simply meets the consensus sales estimate, the stock would probably be punished. Here's why.
| More about Internet stocks
|

|
|
|
|
Revenue of $454 million, excluding TAC, would represent about a 7 percent increase in sales from the second quarter. But Yahoo! reported last week that its marketing services division (the advertising business that competes with Google) reported a sequential sales increase, excluding TAC, of about 10 percent in the third quarter.
"Given the way Google's stock has traded up, I would argue that expectations are above where the printed consensus numbers are," said Mahaney. "A single-digit sequential sales growth rate, given where the stock is, would be seen as a disappointment."
So for Google to prove to Wall Street that it is indeed growing at an equal clip to Yahoo!, it will need to post sales, excluding TAC, that are closer to $465 million.
No guidance? Care to re-think that?
Google may be taking the moral high road in its attempts to not play the Wall Street earnings game. But the lack of guidance could be a disservice.
There is a sizable gap between the highest and lowest earnings estimates for 2005. Forecasts range from a low of $2.01 per share to a peak of $3.88 -- a 50 percent gap.
The consensus is $2.80 per share.
By way of comparison, the consensus 2005 estimate for Yahoo! is 49 cents a share and the range of estimates goes from a low of 43 cents to a high of 56 cents. This means there is a 23 percent difference between the lowest and highest forecasts.
"We have zero data points. Right now it's everyone's best guess as to what Google's 2005 numbers will look like," said Squali.
Is the price really right?
The earnings disparity should be a cause for concern because it impacts the valuation for Google.
| Recently in Tech Biz
|

|
|
|
|
Many analysts argue that Google should trade at a discount to Yahoo!, since Yahoo! is the more diversified company. The market has appeared to price this in. Yahoo! now trades at 72 times 2005 earnings estimates, while Google trades at 53 times the consensus 2005 earnings forecast.
But is that really a fair comparison, considering the wide range of estimates for Google? Squali, for example, is predicting earnings of $2.32 a share for next year. Using that estimate, Google's P/E ratio swells to 65.
Google is a fantastic company that is clearly benefiting from a strong Internet advertising environment. But it probably is not wise for investors to jump on board until there is more of an agreement about how strong earnings growth really will be next year.
Tech Biz Baseball Bet Update: Oy vey. I still think Mr. Hellweg will soon owe me some clam chowder. But this has suddenly become a series. David Ortiz is giving me nightmares in a Linda Blair, head-spinning, pea soup-vomiting kind of way. He's good.
Analysts quoted in this story do not own shares of companies mentioned and their firms have no investment banking ties with the companies.
Sign up to receive the Tech Investor column by e-mail.
Plus, see more tech commentary and get the latest tech news.

|

