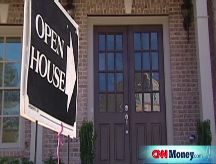
On the path to a housing rebound
The pain that homeowners and homebuilders are feeling now is a sign that things are going to get better.

NEW YORK (Fortune) -- The news that housing starts have fallen to their lowest level in 17 years sounds like one more reason to be depressed about the shrinking value of your home. In fact, it's an almost certain sign that the path to a housing recovery is finally in sight.
If prices are going to stabilize, let alone rebound, the United States needs to produce far more first-time home buyers than new houses. That's the only way to tame the glut of "For Sale" signs dotting front yards from the Inland Empire of California to the Gold Coast of Florida.
Builders constructed far more homes from 2002 until 2006 - the peak bubble years - than could possibly be absorbed by the normal growth in households.
As a result, the market is now swamped with one million new and existing homes for sale that aren't occupied, and hence need to sell quickly. That's a multiple of the figure in most downturns, and it testifies to the duration and girth of the bubble.
"For the recovery to begin, builders need to eliminate the standing inventory of finished, unoccupied new homes," says Mike Castleman, founder of Metrostudy, which assembles sales data on four million subdivisions across the U.S.
The massive overhang of unsold inventory has remained stubbornly high. Sure, builders cut back, but sales dropped just as quickly.
Now that excess supply is finally beginning to shrink. In April, the number of new homes for sale stood at 456,000 according to the U.S. Commerce Department, still a big number, but 93,000 below the mountainous figure a year ago.
The key player in any recovery scenario is the first time buyer. The housing market operates with a pronounced laddering or ripple effect. When entry-level buyers flood the market, they not only stimulate production of new homes, they purchase existing homes. Those purchases, in turn, allow the sellers to move up to bigger houses.
But when the first-timers are absent, the entire buying chain gets frozen.
Today, newbies are coming back. Why? For the first time in years, entry-level homes are affordable. Builders have slashed prices, and what they're building tends to be far smaller than the McMansions of the boom, selling for far lower prices. KB Home's average selling price dropped to $248,0000 in its February quarter, versus $267,000 a year earlier. In 2006, KB's basic model in Victorville, Cal., a former boomtown east of Los Angeles, took up as much as 3,800 square feet and sold for $328,000. Today, its stripped down offering goes for $220,000, at less than half the size.
So the first time in a decade renters can carry the mortgage payments and taxes on a new house for what they're paying a landlord. Call it the New Affordability.
Here's how the numbers play out: Single-family housing starts are now running at fewer than 500,000 a year. The normal demand for housing, based on immigration and household formation, is around one million units.
We won't get back to that figure for a while because so many people rushed to buy homes during the boom.
But with first timers returning, sales should rise to almost 700,000 units by the end of next year, according to Bernard Markstein, senior economist for the National Association of Home Builders. That means sales will soon exceed new production by as much as 250,000 units a year.
That margin forms the foundation of the housing revival that comes in four steps.
Step 1: First, the return of first-time buyers will shrink the overhang of new houses for sale.
Step 2: Second, because so few new homes are being built, first-timers will start buying existing homes from owners who want to move up but have been trapped by the dearth of buyers. Their improved fortunes, though, come with a big caveat: The prices of new homes are now lower than comparably-sized existing homes. It's as if used cars are selling for more than new ones. That can't last. So move-up buyers are going to have to accept less than they had hoped to get for their current homes.
They'll get a big break as they trade up, however. Unless they bought at the height of the boom, they'll still sell at a profit. They can then use that equity to buy bigger homes at bargain prices. During the bubble, homebuilders started pushing up home sizes to 3,500 square feet or more. It's those behemoths that are selling for the steepest discounts today.
Step 3: Next, housing starts should start rising, probably next year. The increase, however, will be slow and gradual. For the next two years at least, homebuilders will compete ferociously with existing home sellers for customers.
Step 4: Eventually, the glut of existing homes will disappear as well. The excess of new-home buyers over new homes being built makes that inevitable. But the oversupply is so enormous that the healing process could take as much as three more years. Only then will prices in former bubble markets start rising again.
One event has the potential to slow or even derail the recovery: A sharp rise in interest rates. Right now, the first-timers are gorging on 6% loans guaranteed by the FHA. But rates may not stay there.
If they rise to 8% or higher because inflation rebounds, it would take a far bigger drop in prices to make new and existing homes affordable.
The New Affordability is now in place. But if rates rise, we'll have to establish a New New Affordability - at even lower prices. ![]()
-
 The retail giant tops the Fortune 500 for the second year in a row. Who else made the list? More
 -
 This group of companies is all about social networking to connect with their customers. More
 -
 The fight over the cholesterol medication is keeping a generic version from hitting the market. More
 -
 Bin Laden may be dead, but the terrorist group he led doesn't need his money. More
 -
 U.S. real estate might be a mess, but in other parts of the world, home prices are jumping. More
 -
 Libya's output is a fraction of global production, but it's crucial to the nation's economy. More
 -
 Once rates start to rise, things could get ugly fast for our neighbors to the north. More


