 To see the tax rate in your state, click here.
NEW YORK (CNNMoney) -- State tax burdens for Americans fell for the first time in a decade during the recession.
U.S. residents paid an average 9.8% of their income in state and local taxes in 2009, according to a study the Tax Foundation released Wednesday.
That's down modestly from 9.9% in 2008 and reverses the upward trend seen over the past decade, as the recession crippled the economy and consumer spending. In fact, the latest tax burden results mark the first decline since 2000, the study shows.
"The 2009 fiscal year was a tough one for states and for taxpayers," said Mark Robyn, staff economist at the Tax Foundation and author of the study.
That said, state and local taxes remain down substantially from the national average of 10.4% in 1977, when the study was first published.
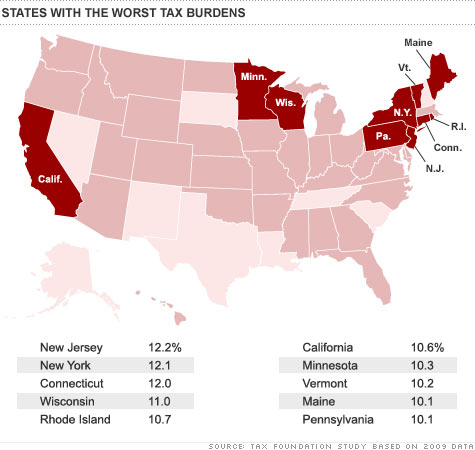
In the latest report, residents of New York, New Jersey and Connecticut felt the biggest blow to their wallets, all paying more than 12% of their income in state and local taxes. These three states have carried the highest tax burdens since 2005, with higher average incomes resulting in more spending.
Taxpayers living in Alaska, Nevada, South Dakota, Tennessee, Wyoming and Texas all paid less than 8% in taxes, with Alaskan residents paying the lowest rate of 6.3%.
The study tracks taxes spent by a state's residents, even if the taxes are paid to another state. Nationwide, more than a quarter of all state and local tax revenue is collected from non-residents. (Think hotel taxes, gas taxes when people come to visit, etc.)
So in the case of Alaska, most of its tax revenue comes from residents of other states.
"Alaska is able to shift almost 80% of its tax collections to residents of other states," said Robyn. "While taxpayers in 43 states are busy filing state income tax returns in April, Alaskans are instead receiving checks from a multi-billion-dollar reserve fund built up from years of taxes on oil extraction."
The majority of states saw taxes fall in 2009, the report showed. The District of Columbia, Maryland, and New Mexico led the declines, with all three states experiencing drops in tax burdens of about 1%. ![]()
| State-Local Tax Burdens, All States 2009 |
||||
|---|---|---|---|---|
| State | Rate | Rank (1 is highest) |
Total State and Local Per Capita Taxes Paid | Per Capita Income |
| United States | 9.8% | – | $4,160 | $42,539 |
| Alabama | 8.5% | 40 | $2,967 | $34,911 |
| Alaska | 6.3% | 50 | $2,973 | $46,841 |
| Arizona | 8.7% | 38 | $3,140 | $36,228 |
| Arkansas | 9.9% | 14 | $3,281 | $33,238 |
| California | 10.6% | 6 | $4,910 | $46,366 |
| Colorado | 8.6% | 39 | $4,011 | $46,716 |
| Connecticut | 12.0% | 3 | $7,256 | $60,310 |
| Delaware | 9.6% | 23 | $4,091 | $42,688 |
| Florida | 9.2% | 31 | $3,897 | $42,146 |
| Georgia | 9.1% | 32 | $3,350 | $36,738 |
| Hawaii | 9.6% | 22 | $4,399 | $45,725 |
| Idaho | 9.4% | 28 | $3,276 | $34,973 |
| Illinois | 10.0% | 13 | $4,596 | $46,079 |
| Indiana | 9.5% | 25 | $3,396 | $35,767 |
| Iowa | 9.5% | 24 | $3,688 | $38,688 |
| Kansas | 9.7% | 19 | $3,911 | $40,302 |
| Kentucky | 9.3% | 30 | $3,059 | $32,959 |
| Louisiana | 8.2% | 42 | $3,037 | $37,109 |
| Maine | 10.1% | 9 | $3,832 | $37,835 |
| Maryland | 10.0% | 12 | $5,218 | $52,130 |
| Massachusetts | 10.0% | 11 | $5,316 | $53,029 |
| Michigan | 9.7% | 21 | $3,565 | $36,880 |
| Minnesota | 10.3% | 7 | $4,651 | $45,220 |
| Mississippi | 8.7% | 36 | $2,678 | $30,689 |
| Missouri | 9.0% | 34 | $3,425 | $37,853 |
| Montana | 8.7% | 35 | $3,216 | $36,784 |
| Nebraska | 9.8% | 15 | $3,960 | $40,349 |
| Nevada | 7.5% | 49 | $3,311 | $44,241 |
| New Hampshire | 8.0% | 44 | $3,765 | $46,828 |
| New Jersey | 12.2% | 1 | $6,751 | $55,303 |
| New Mexico | 8.4% | 41 | $2,997 | $35,780 |
| New York | 12.1% | 2 | $6,157 | $51,055 |
| North Carolina | 9.8% | 16 | $3,583 | $36,650 |
| North Dakota | 9.5% | 26 | $3,892 | $41,088 |
| Ohio | 9.7% | 18 | $3,652 | $37,600 |
| Oklahoma | 8.7% | 37 | $3,259 | $37,464 |
| Oregon | 9.8% | 17 | $3,761 | $38,527 |
| Pennsylvania | 10.1% | 10 | $4,190 | $41,672 |
| Rhode Island | 10.7% | 5 | $4,647 | $43,372 |
| South Carolina | 8.1% | 43 | $2,742 | $33,954 |
| South Dakota | 7.6% | 48 | $3,042 | $40,082 |
| Tennessee | 7.6% | 47 | $2,752 | $36,157 |
| Texas | 7.9% | 45 | $3,197 | $40,498 |
| Utah | 9.7% | 20 | $3,349 | $34,596 |
| Vermont | 10.2% | 8 | $4,181 | $41,061 |
| Virginia | 9.1% | 33 | $4,392 | $48,210 |
| Washington | 9.3% | 29 | $4,408 | $47,361 |
| West Virginia | 9.4% | 27 | $3,034 | $32,299 |
| Wisconsin | 11.0% | 4 | $4,427 | $40,321 |
| Wyoming | 7.8% | 46 | $4,205 | $53,931 |
| District of Columbia | 9.6% | $6,076 | $63,492 | |


| Overnight Avg Rate | Latest | Change | Last Week |
|---|---|---|---|
| 30 yr fixed | 3.80% | 3.88% | |
| 15 yr fixed | 3.20% | 3.23% | |
| 5/1 ARM | 3.84% | 3.88% | |
| 30 yr refi | 3.82% | 3.93% | |
| 15 yr refi | 3.20% | 3.23% |
Today's featured rates:


| Index | Last | Change | % Change |
|---|---|---|---|
| Dow | 32,627.97 | -234.33 | -0.71% |
| Nasdaq | 13,215.24 | 99.07 | 0.76% |
| S&P 500 | 3,913.10 | -2.36 | -0.06% |
| Treasuries | 1.73 | 0.00 | 0.12% |
| Company | Price | Change | % Change |
|---|---|---|---|
| Ford Motor Co | 8.29 | 0.05 | 0.61% |
| Advanced Micro Devic... | 54.59 | 0.70 | 1.30% |
| Cisco Systems Inc | 47.49 | -2.44 | -4.89% |
| General Electric Co | 13.00 | -0.16 | -1.22% |
| Kraft Heinz Co | 27.84 | -2.20 | -7.32% |
|
Bankrupt toy retailer tells bankruptcy court it is looking at possibly reviving the Toys 'R' Us and Babies 'R' Us brands. More |
Land O'Lakes CEO Beth Ford charts her career path, from her first job to becoming the first openly gay CEO at a Fortune 500 company in an interview with CNN's Boss Files. More |
Honda and General Motors are creating a new generation of fully autonomous vehicles. More |
In 1998, Ntsiki Biyela won a scholarship to study wine making. Now she's about to launch her own brand. More |
Whether you hedge inflation or look for a return that outpaces inflation, here's how to prepare. More |

