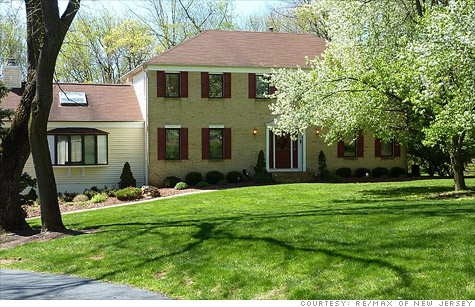
Surbuban New York has the highest median taxes in the nation. This beautiful Hunterdon County, N.J. house lists for $588,888 and the buyer will pay more than $13,000 annually in property taxes.
NEW YORK (CNNMoney) -- Of the 10 counties with the highest property taxes in the United States, all are in New Jersey and New York. Connecticut and New Hampshire also had counties that finished high in the rankings.
At the other end of the spectrum with the lowest property tax rates are Louisiana and Alaska, according to new calculations from the Tax Foundation, a Washington-based nonprofit that researches tax policy. It used Census data covering five years ended in 2009.
Two main factors contribute to property taxes, according to Nick Kasprak, a Tax Foundation analyst: the amount of services local governments provide, and the revenue shared by state governments.
"When a lot of the responsibility for running programs lies with local governments, residents pay for that with higher property taxes," he said.
Northeastern counties often spend a lot on schools, recreational facilities and expensive police and fire departments.
Lower tax areas spend less on these services. They may, for instance, have volunteer fire departments. ('10 biggest money wasters')
Kasprak said some states even impose tough costs on local governments, such as maintaining minimum school standards or low-income housing, which the locals governments raise taxes to pay for.
States with low property taxes often get revenues from taxing oil production, gambling or other deep pocketed industries. Louisiana and Alaska raise much of their budget that way.
Hunterdon County, in northwestern New Jersey, had the nation's highest median property tax. The typical homeowner there paid $8,216 annually.
Taxes in Nassau, on Long Island, where the median property tax was $8,206, and Westchester ($8,160), just north of New York City, were only slightly lower. ('Rent or Buy: 10 cities rated')
There are higher tax counties based on taxes as a percentage of home values. In Orleans County, N.Y., west of Rochester, the typical tax bite came to $2,578. Since the median home price there was a mere $84,600, homeowners pay 3% of the value of their homes in taxes annually.
The lowest taxes as a percentage of home value was in an area east of Fairbanks, Alaska, where the owners paid $109 a year, just 0.07%, on a median home value of $159,300. And seniors in Alaska are exempt from paying taxes on the first $150,000 of home value so many pay no property taxes at all.
High taxes can drive away residents, especially retirees, according to Bruce Hahn, president of the American Homeowners Grassroots Alliance.
"They move to smaller homes further out, where values are lower, as are tax rates," said Hahn. "It gives them a triple savings."
Hahn said he himself lives in Arlington Va., where he pays more than $6,000 a year. ("I hate it," he said.) He also has a smaller place in West Virginia, where the taxes are only $350.
No matter how much your property tax bill is, don't expect it to decline, even though home values have dropped. The tax men will find ways to keep revenue streaming, according to Hahn, usually by upping the rates for everyone.
"They're under pressure because property taxes are such an important part of local budgets," he said. ![]()
| Overnight Avg Rate | Latest | Change | Last Week |
|---|---|---|---|
| 30 yr fixed | 3.80% | 3.88% | |
| 15 yr fixed | 3.20% | 3.23% | |
| 5/1 ARM | 3.84% | 3.88% | |
| 30 yr refi | 3.82% | 3.93% | |
| 15 yr refi | 3.20% | 3.23% |
Today's featured rates:


