5 ways to know if the bull is over

Before it keels over, a bull market typically leaves a few road signs. Here's what to keep an eye on - from Money Magazine.

Treasury yields
Treasury yields
Before a bear: Treasury yields often run up
Happened yet? Not really

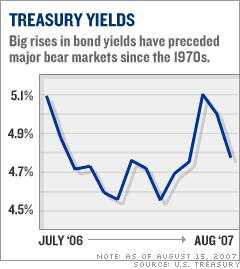
Big market pullbacks tend to take place after jumps in the yield of the 10-year Treasury note. Bear markets in the mid-'70s, early and late '80s, early '90s and 2000 all followed significant rises in bond yields. For example, the yield on the 10-year surged from 7 percent in January 1987 to 10.2 percent just before the October crash.

What about now? The 10-year yield rose from about 4.5 percent in mid-March to 5.2 percent in June but dropped back to around 4.7 percent in mid August.

"If the yield on the 10-year went up to 6 percent," says Jeffrey Saut, chief investment strategist for Raymond James Financial, "that could change investor psychology" - and help send the bull packing.

The state of the dollar affects Treasury yields too. A weakening dollar makes foreign investors nervous about holding Treasuries; when they sell, Treasury prices fall and yields rise.

"That would hit stocks, just like in 1987," says Subodh Kumar, an independent market strategist. The dollar has sagged - from $1.29 to the euro at the beginning of the year to $1.34 to the euro in mid August. If it slips further, that's a warning sign, Kumar says.

Outlook Oil prices Treasury yields Number of rising stocks Consumer spending Corporate earnings growth
Report: Big-money investors at one-year high for risk aversion. (more)
Is the worst over? Here's a 10-point guide to understanding two harrowing weeks - and what's likely to happen next. (more)
But strength of markets, economy should prevent a recession, Treasury Secretary says in a news report. (more)

Most stock quote data provided by BATS. Market indices are shown in real time, except for the DJIA, which is delayed by two minutes. All times are ET. Disclaimer. Morningstar: © 2018 Morningstar, Inc. All Rights Reserved. Factset: FactSet Research Systems Inc. 2018. All rights reserved. Chicago Mercantile Association: Certain market data is the property of Chicago Mercantile Exchange Inc. and its licensors. All rights reserved. Dow Jones: The Dow Jones branded indices are proprietary to and are calculated, distributed and marketed by DJI Opco, a subsidiary of S&P Dow Jones Indices LLC and have been licensed for use to S&P Opco, LLC and CNN. Standard & Poor's and S&P are registered trademarks of Standard & Poor's Financial Services LLC and Dow Jones is a registered trademark of Dow Jones Trademark Holdings LLC. All content of the Dow Jones branded indices © S&P Dow Jones Indices LLC 2018 and/or its affiliates.

Most stock quote data provided by BATS. Market indices are shown in real time, except for the DJIA, which is delayed by two minutes. All times are ET. Disclaimer. Morningstar: © 2018 Morningstar, Inc. All Rights Reserved. Factset: FactSet Research Systems Inc. 2018. All rights reserved. Chicago Mercantile Association: Certain market data is the property of Chicago Mercantile Exchange Inc. and its licensors. All rights reserved. Dow Jones: The Dow Jones branded indices are proprietary to and are calculated, distributed and marketed by DJI Opco, a subsidiary of S&P Dow Jones Indices LLC and have been licensed for use to S&P Opco, LLC and CNN. Standard & Poor's and S&P are registered trademarks of Standard & Poor's Financial Services LLC and Dow Jones is a registered trademark of Dow Jones Trademark Holdings LLC. All content of the Dow Jones branded indices © S&P Dow Jones Indices LLC 2018 and/or its affiliates.