5 ways to know if the bull is over

Before it keels over, a bull market typically leaves a few road signs. Here's what to keep an eye on - from Money Magazine.

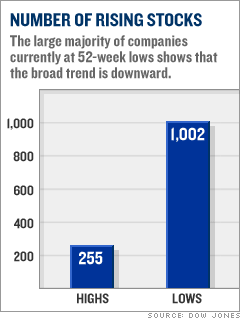
Number of rising stocks
Before a bear: The number of rising stocks starts to shrink
Happened yet? Has it ever

Before the market crashed in 2000, something fundamental changed. Though the overall indexes (like the Dow and the S&P 500) kept going up, those rises were being fueled by only a handful of companies, mostly Internet-related ones.

The lesson: Sizable increases in just a few stocks can mask what's going on in the broader market and signal that a bull is nearing a top, says Larry Haverty, a portfolio manager with Gamco Investors, an institutional investment firm. So keep an eye on market breadth - that is, how many stocks are rising compared with how many are falling.

If more stocks on the New York Stock Exchange are hitting new 52-week lows than new 52-week highs, that's a bad sign.

In mid-July nearly twice as many stocks were hitting new highs as new lows - a comforting sign - but by month's end this stat had turned downright ugly.

Outlook Oil prices Treasury yields Number of rising stocks Consumer spending Corporate earnings growth
Report: Big-money investors at one-year high for risk aversion. (more)
Is the worst over? Here's a 10-point guide to understanding two harrowing weeks - and what's likely to happen next. (more)
But strength of markets, economy should prevent a recession, Treasury Secretary says in a news report. (more)

Most stock quote data provided by BATS. Market indices are shown in real time, except for the DJIA, which is delayed by two minutes. All times are ET. Disclaimer. Morningstar: © 2018 Morningstar, Inc. All Rights Reserved. Factset: FactSet Research Systems Inc. 2018. All rights reserved. Chicago Mercantile Association: Certain market data is the property of Chicago Mercantile Exchange Inc. and its licensors. All rights reserved. Dow Jones: The Dow Jones branded indices are proprietary to and are calculated, distributed and marketed by DJI Opco, a subsidiary of S&P Dow Jones Indices LLC and have been licensed for use to S&P Opco, LLC and CNN. Standard & Poor's and S&P are registered trademarks of Standard & Poor's Financial Services LLC and Dow Jones is a registered trademark of Dow Jones Trademark Holdings LLC. All content of the Dow Jones branded indices © S&P Dow Jones Indices LLC 2018 and/or its affiliates.

Most stock quote data provided by BATS. Market indices are shown in real time, except for the DJIA, which is delayed by two minutes. All times are ET. Disclaimer. Morningstar: © 2018 Morningstar, Inc. All Rights Reserved. Factset: FactSet Research Systems Inc. 2018. All rights reserved. Chicago Mercantile Association: Certain market data is the property of Chicago Mercantile Exchange Inc. and its licensors. All rights reserved. Dow Jones: The Dow Jones branded indices are proprietary to and are calculated, distributed and marketed by DJI Opco, a subsidiary of S&P Dow Jones Indices LLC and have been licensed for use to S&P Opco, LLC and CNN. Standard & Poor's and S&P are registered trademarks of Standard & Poor's Financial Services LLC and Dow Jones is a registered trademark of Dow Jones Trademark Holdings LLC. All content of the Dow Jones branded indices © S&P Dow Jones Indices LLC 2018 and/or its affiliates.