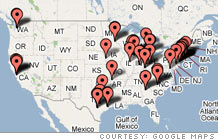
FORTUNE 500 Headquarters

Click to enlarge
Show FORTUNE 500 Companies:
Other lists
This company also appears on other rankings. Most recently:
| Revenues |
4,781.4 |
43.7 |
| Profits |
50.9 |
210.5 |
| Assets |
2,529.1 |
— |
| Stockholders' Equity |
1,243.2 |
— |
| Market Value 3/23/2007 |
2,584.3 |
— |
| Revenues |
1.1 |
| Assets |
2.0 |
| Stockholders' equity |
4.1 |
| 2006 $ |
0.63 |
| % change from 2005 |
173.9 |
| 1996-2006 annual growth rate % |
3.0 |
| 2006 |
15.2 |
| 1996-2006 annual rate |
11.1 |
| 1 |
Fluor
|
174 |
14,078.5 |
| 2 |
Jacobs Engineering Grp.
|
322 |
7,421.3 |
| 3 |
Peter Kiewit Sons'
|
446 |
5,049.0 |
| 4 |
Emcor Group
|
448 |
5,021.0 |
| 5 |
Shaw Group
|
464 |
4,781.4 |
| 6 |
URS
|
505 |
4,240.1 |
| 7 |
CH2M Hill
|
526 |
4,006.9 |
| 8 |
Washington Group Intl.
|
590 |
3,398.1 |
| 9 |
Perini
|
648 |
3,042.8 |
| 10 |
Granite Construction
|
654 |
2,969.6 |
| 11 |
Quanta Services
|
823 |
2,131.0 |
From the April 30th, 2007 issue

America's largest corporations generated record earnings in 2006, thanks to a happy confluence of circumstances. How much longer can the outpouring last? ( more)

Unlike its rivals, the most profitable company in history doesn't much care about alternative fuels and doesn't try to please the greens. Is CEO Rex Tillerson nuts – or shrewd? ( more)
|
| Most profitable companies |
|