2010
2009
2008
2007
2006
1955-2005
Our annual ranking of America's largest corporations
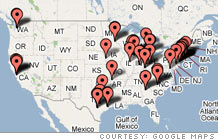
FORTUNE 500 Headquarters
Click to enlarge
Show FORTUNE 500 Companies:
Revenues
4,785.5
-6.2
Profits
204.0
-11.7
Assets
13,564.8
—
Stockholders' Equity
5,423.4
—
Market Value 3/23/2007
—
—
Revenues
4.3
Assets
1.5
Stockholders' equity
3.8
2006 $
N.A.
% change from 2005
N.A.
1996-2006 annual growth rate %
N.A.
2006
N.A.
1996-2006 annual rate
N.A.
1
American Intl. Group
10
113,194.0
2
Berkshire Hathaway
12
98,539.0
3
Allstate
61
35,796.0
4
Hartford Financial Services
82
26,500.0
5
Travelers Cos.
89
25,090.0
6
Liberty Mutual Ins. Group
95
23,520.0
7
Nationwide
104
22,253.0
8
Loews
135
17,227.6
9
Progressive
159
14,786.4
10
Chubb
176
14,003.0
11
USAA
180
13,416.4
12
Fidelity National Financial
264
9,436.1
13
First American Corp.
289
8,499.1
14
American Family Ins. Grp.
338
6,893.1
15
Safeco
363
6,289.9
16
W.R. Berkley
423
5,394.8
17
Erie Insurance Group
463
4,785.5
18
Cincinnati Financial
484
4,550.0
19
American Financial Grp.
503
4,254.0
20
LandAmerica Financial
522
4,015.9
21
Old Republic Intl.
548
3,794.2
22
FM Global
578
3,474.4
23
Mercury General
622
3,168.7
24
Unitrin
638
3,075.5
25
MBIA
691
2,723.2
26
Hanover Insurance Group
710
2,644.1
27
Markel
739
2,519.0
28
Stewart Information Services
750
2,471.5
29
HCC Insurance Holdings
836
2,075.3
30
Commerce Group
873
1,949.5
31
Ambac Financial Group
912
1,832.1
32
Selective Insurance Group
919
1,807.9
33
Ohio Casualty
951
1,676.3
From the April 30th, 2007 issue
America's largest corporations generated record earnings in 2006, thanks to a happy confluence of circumstances. How much longer can the outpouring last? (
more )
Unlike its rivals, the most profitable company in history doesn't much care about alternative fuels and doesn't try to please the greens. Is CEO Rex Tillerson nuts � or shrewd? (
more )
Most profitable companies