2 of 100
BACKNEXT
2. Green Mountain Coffee Roasters
3-year average
Revenue Growth: 63%
Profit Growth: 69%
Total Return: 120%
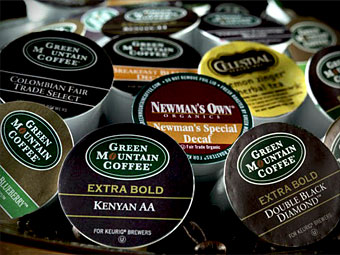
Green Mountain is known as much for its K-cups, the single-serve coffee pods that are ubiquitous in corporate offices these days, as it is for its coffee. The company dominates the single-serve market and boasts customers such as ConAgra Foods, Starbucks, and Dunkin' Donuts, which use K-cups for hot cocoa, teas and coffees. Some 82% of company sales stem from the pod and the "Keurig Brewing System."

It's lucrative for Green Mountain, which charges the equivalent of $35 a pound for coffee in K-cups, according to Greg Fraser of the GRT Absolute Return fund. But Green Mountain faces the loss of patent protection for the K-Cups in 2012, which could crimp revenues and profits going forward.
Get stock quote: GMCR
Revenue ($ millions): $1912.4
Net Income ($ millions): $113
Industry: Beverages
Network with Green Mountain Coffee Roasters
What businesses do you think are primed to grow in this economy?
From the September 26, 2011 issue.
Revenue and profit figures reflect the four quarters ended on or before April 30,2011.
Total return is through June 30, 2011.

Sturm Ruger & Co 848%
Cirrus Logic 340%
Hi-Tech Pharmacal 234%
Green Mountain Coffee Roasters 120%
Netflix 116%
Acme Packet 108%
To qualify, a company -- domestic or foreign -- must be trading on a major U.S. stock exchange; file quarterly reports to the SEC; have a minimum market... More
Current Issue
  • Give the gift of Fortune
  • Get the Fortune app
  • Subscribe

Most stock quote data provided by BATS. Market indices are shown in real time, except for the DJIA, which is delayed by two minutes. All times are ET. Disclaimer. Morningstar: © 2018 Morningstar, Inc. All Rights Reserved. Factset: FactSet Research Systems Inc. 2018. All rights reserved. Chicago Mercantile Association: Certain market data is the property of Chicago Mercantile Exchange Inc. and its licensors. All rights reserved. Dow Jones: The Dow Jones branded indices are proprietary to and are calculated, distributed and marketed by DJI Opco, a subsidiary of S&P Dow Jones Indices LLC and have been licensed for use to S&P Opco, LLC and CNN. Standard & Poor's and S&P are registered trademarks of Standard & Poor's Financial Services LLC and Dow Jones is a registered trademark of Dow Jones Trademark Holdings LLC. All content of the Dow Jones branded indices © S&P Dow Jones Indices LLC 2018 and/or its affiliates.