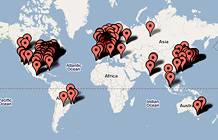
| 1 | China Life Insurance | 159 | 1,588.4 | 2,936.0 | | 2 | China FAW Group | 303 | 842.8 | 659.8 | | 3 | Akzo Nobel | 455 | 782.8 | 12,770.6 | | 4 | Shanghai Automotive | 373 | 643.9 | 667.2 | | 5 | LG | 67 | 505.5 | 2,916.1 | | 6 | China Railway Construction | 356 | 489.0 | 413.3 | | 7 | Peugeot | 66 | 448.6 | 1,211.4 | | 8 | George Weston | 254 | 391.6 | 524.3 | | 9 | Ko� Holding | 186 | 350.2 | 1,758.2 | | 10 | Mitsubishi Motors | 350 | 306.5 | 303.9 | | 11 | Softbank | 330 | 286.1 | 951.2 | | 12 | Rosneft Oil | 203 | 264.1 | 12,862.0 | | 13 | Royal Ahold | 137 | 255.7 | 4,011.8 | | 14 | Groupe Danone | 423 | 237.0 | 5,721.4 | | 15 | China Ocean Shipping | 405 | 236.5 | 3,677.6 | | 16 | China Minmetals | 412 | 230.5 | 510.2 | | 17 | Tata Steel | 315 | 224.8 | 3,000.2 | | 18 | Fujifilm Holdings | 323 | 210.5 | 914.4 | | 19 | Intesa Sanpaolo | 144 | 209.1 | 9,923.5 | | 20 | Bayer | 155 | 205.4 | 6,448.2 | | 21 | Lenovo Group | 499 | 200.4 | 484.0 | | 22 | Sony | 75 | 199.5 | 3,234.9 | | 23 | LyondellBasell Industries | 492 | 197.0 | 1,032.0 | | 24 | China Railway Group | 341 | 191.6 | 415.9 | | 25 | Eiffage | 488 | 189.4 | 1,368.8 | | 26 | Cathay Financial Holdings | 300 | 187.8 | 935.9 | | 27 | Xstrata | 272 | 184.7 | 5,543.0 | | 28 | ABB | 256 | 170.3 | 3,757.0 | | 29 | NEC | 174 | 154.5 | 198.6 | | 30 | Hyundai Heavy Industries | 378 | 152.6 | 1,861.2 | | 31 | Samsung C&T | 475 | 151.1 | 514.2 | | 32 | Thales Group | 498 | 149.5 | 1,214.6 | | 33 | British Airways | 478 | 148.8 | 1,364.7 | | 34 | National Grid | 351 | 143.3 | 6,414.1 | | 35 | Mapfre Group | 463 | 141.6 | 1,000.6 | | 36 | William Morrison Supermarkets | 310 | 141.3 | 1,108.9 | | 37 | Fonci�re Euris | 205 | 136.9 | 225.8 | | 38 | China State Construction | 385 | 129.8 | 646.5 | | 39 | Lufthansa Group | 250 | 124.8 | 2,265.3 | | 40 | AMR | 366 | 118.2 | 504.0 | | 41 | Nippon Oil | 117 | 116.3 | 1,298.6 | | 42 | Agricultural Bank of China | 223 | 114.3 | 1,560.9 | | 43 | Abbott Laboratories | 312 | 110.1 | 3,606.3 | | 44 | Alstom | 338 | 109.9 | 1,205.7 | | 45 | China Metallurgical Group | 480 | 106.9 | 383.7 | | 46 | Freeport-McMoRan Copper & Gold | 469 | 104.4 | 2,977.0 | | 47 | Fluor | 500 | 102.4 | 533.3 | | 48 | Raytheon | 379 | 100.9 | 2,578.0 | | 49 | Fiat | 71 | 100.1 | 2,673.2 | | 50 | ArcelorMittal | 39 | 98.4 | 10,368.0 |
|
From the July 21, 2008 issue
|
|
|


