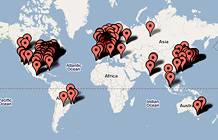
| 1 | Tata Steel | 315 | 353.2 | 25,706.9 | | 2 | Freeport-McMoRan Copper & Gold | 469 | 208.7 | 17,876.0 | | 3 | Intesa Sanpaolo | 144 | 132.3 | 48,305.0 | | 4 | KFW Bankengruppe | 199 | 111.3 | 36,756.7 | | 5 | Enterprise GP Holdings | 301 | 90.9 | 26,713.8 | | 6 | AT&T | 29 | 88.6 | 118,928.0 | | 7 | ArcelorMittal | 39 | 78.7 | 105,216.0 | | 8 | CVS Caremark | 80 | 74.2 | 76,329.5 | | 9 | Mapfre Group | 463 | 73.4 | 17,984.4 | | 10 | Iberdrola | 339 | 73.0 | 23,909.5 | | 11 | Noble Group | 349 | 70.7 | 23,497.1 | | 12 | ACS | 270 | 65.3 | 29,170.6 | | 13 | Xstrata | 272 | 65.0 | 29,084.0 | | 14 | Rosneft Oil | 203 | 64.8 | 36,184.0 | | 15 | CVRD | 235 | 64.1 | 32,242.0 | | 16 | Fomento de Construcciones | 440 | 61.1 | 19,267.1 | | 17 | PTT | 135 | 59.7 | 51,192.5 | | 18 | Landesbank Baden-WŁrttemberg | 185 | 54.2 | 39,458.8 | | 19 | China Metallurgical Group | 480 | 54.1 | 17,514.7 | | 20 | Dexia Group | 19 | 54.0 | 147,648.4 | | 21 | State Bank of India | 380 | 48.2 | 22,402.2 | | 22 | Bayerische Landesbank | 297 | 46.5 | 27,278.1 | | 23 | Sabic | 227 | 46.3 | 33,677.6 | | 24 | Flextronics International | 292 | 45.3 | 27,558.1 | | 25 | China Construction Bank | 171 | 44.8 | 41,306.9 | | 26 | Sberbank | 406 | 44.3 | 20,784.5 | | 27 | Bunge | 191 | 44.0 | 37,842.0 | | 28 | Nationwide Building Society | 414 | 43.9 | 20,437.7 | | 29 | Quanta Computer | 344 | 43.1 | 23,664.5 | | 30 | Reliance Industries | 206 | 42.8 | 35,914.9 | | 31 | Erste Bank | 447 | 41.8 | 18,836.1 | | 32 | China FAW Group | 303 | 41.0 | 26,391.1 | | 33 | Industrial & Commercial Bank of China | 133 | 39.9 | 51,525.5 | | 34 | Rite Aid | 328 | 39.5 | 24,417.7 | | 35 | Agricultural Bank of China | 223 | 39.2 | 34,059.3 | | 36 | China Communications Construction | 426 | 38.6 | 19,990.7 | | 37 | Woori Finance Holdings | 279 | 37.6 | 28,678.7 | | 38 | Schneider Electric | 342 | 37.5 | 23,691.4 | | 39 | Alcatel-Lucent | 325 | 36.6 | 24,644.6 | | 40 | Scottish & Southern Energy | 253 | 36.4 | 30,618.2 | | 41 | Nordea Bank | 354 | 36.4 | 23,415.4 | | 42 | Fortis | 14 | 36.0 | 164,877.0 | | 43 | Aluminum Corp. of China | 476 | 35.9 | 17,576.9 | | 44 | Nokia | 88 | 35.5 | 69,886.3 | | 45 | National Grid | 351 | 35.5 | 23,479.0 | | 46 | China Ocean Shipping | 405 | 35.2 | 20,840.4 | | 47 | Statoil Hydro | 59 | 34.6 | 89,223.9 | | 48 | Banco Bilbao Vizcaya Argentaria | 134 | 34.3 | 51,449.0 | | 49 | Royal Bank of Scotland | 36 | 33.8 | 108,392.0 | | 50 | Asustek Computer | 363 | 33.5 | 22,992.5 |
|
From the July 21, 2008 issue
|
|
|


