|
Dow: Green light for record Blue-chip indicator hits highest intraday point ever as decline in oil prices proves to be the catalyst. NEW YORK (CNNMoney.com) -- The Dow Jones industrial average hit its highest level ever Tuesday afternoon, taking out the record trading high hit in January 2000, before backing off a little bit, as investors scooped up a variety of shares amid slumping oil prices. The Dow industrials (up 78.36 to 11,748.71, Charts) added 0.6 percent with roughly 2 hours left in the session and took out its all-time trading high of 11,750.28 hit on Jan. 14, 2000. The Dow reached as high as 11,755.35 before easing.
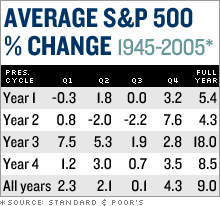
The blue-chip indicator remained above its record closing high of 11,722.98, also hit on Jan. 14, 2000. The S&P 500 (up 5.44 to 1,336.76, Charts) index added 0.4 percent Tuesday and flirted with a fresh 5-1/2 year high. The broad index topped out at a 5-1/2 year high last Thursday and has struggled since then. The Nasdaq composite (up 11.26 to 2,248.86, Charts) added 0.4 percent. A selloff in tech and commodities stocks weighed on the Nasdaq throughout the morning, keeping the broader market in check. But the tone improved near midday, with investors betting that the steep decline in oil prices means that inflationary pressures are diminishing and the economy is likely headed for a slowdown, not a recession, as has been feared. "The catalyst today is falling oil prices," said Peter Cardillo, chief market analyst at S.W. Bach & Co. "Oil under $60 a barrel today is giving the Dow ammunition to make another try for those record highs." U.S. light crude oil for November delivery fell $2.14 to $58.89 a barrel on the New York Mercantile Exchange, after falling as low as $58.83 earlier. Road to the record The Dow hit an all-time high in January 2000 near the end of the late 1990's Internet boom. The Nasdaq and the S&P 500 peaked around two months later. But the stock market began slipping soon after, and within two months, the Dow had given back 8 percent. The major gauges recovered most of the losses that April, slipped back and then tried again to recover in August, before giving up altogether and heading lower. The bursting of the Internet bubble, the recession that ended in 2001 and the events of 9/11 all played a role in a bear market that stretched for 3 years. Stocks bottomed out in October 2002, and have slowly recovered since then, although the Nasdaq remains more than 50 percent below its all-time high. Last May, the S&P 500 hit a 5-1/2 year high and the Dow closed at its highest point since the 2000 record. But the blue-chip averages were unable to take out the records and stocks slid through the summer. Record high oil prices and worries about another recession paced the selloff. But stocks turned it around again in August and September of this year thanks to a few key events: oil prices tumbled, the Federal Reserve paused its more than two-year old interest-rate hiking campaign and investors saw signs that the economy is slowing, but not heading for a recession. Last week, the major gauges finished out the best third quarter since 1997. The S&P 500 rose just short of 5 percent in the third quarter, while the Dow gained 4.5 percent. The Nasdaq gained 3.8 percent. Tuesday's movers The fall in oil prices was good news for most sectors of the stock market, with 23 out of 30 Dow issues rising. Gainers included aerospace issues such as Boeing (up $1.93 to $81.90, Charts) and Honeywell (up $0.58 to $41.93, Charts) and bank stocks such as JP Morgan (up $0.80 to $47.67, Charts) and Citigroup (up $0.72 to $50.21, Charts). However, the plunge in oil prices was bad news for oil stocks, which slumped. Exxon Mobil (down $1.10 to $65.90, Charts) and Valero Energy (down $2.18 to $48.76, Charts) were among the stocks dragging down the Amex Oil (down 30.91 to 1,043.05, Charts) index. COMEX gold for December delivery fell $22.30 to $581 an ounce. That sparked a selloff in gold stocks, with the Amex Gold Bugs (down $19.33 to $283.54, Charts) index losing 5.4 percent. Among other movers, Marvell Technology (down $2.30 to $16.79, Charts) shares plunged 13 percent in active trade after saying late Monday that it will restate financial results going back to its initial public offering in 2000, due to misdated stock options. The chipmaker also warned that third-quarter sales will be down 10 percent from the previous quarter, due to weaker demand from disk-drive makers. Market breadth was mixed. On the New York Stock Exchange, winners beat losers 9 to 7 as 1.03 billion shares changed hands. On the Nasdaq, advancers and decliners were roughly even on volume of 1.27 billion shares. Treasury prices inched lower. The yield on the 10-year note stood at 4.62 percent, up from around 4.60 percent late Monday. Treasury prices and yields move in opposite directions. Housing stocks: Don't wade in yet Money 65: Best mutual funds in every category Market Lists: Most actives, biggest gainers, biggest losers. |
|

