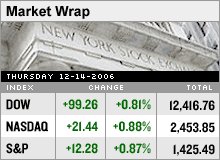
Dow hits highest close everS&P hits high for the year as investors welcome upbeat bank earnings, shrug off jump in oil prices; techs rally.NEW YORK (CNNMoney.com) -- Stocks surged Thursday, sending the Dow Jones industrial average to a record close and the S&P 500 to a more than six-year high, thanks to upbeat earnings from the banking sector, a drop in jobless claims and a rebound in technology. The Dow (up 99.26 to 12,416.76, Charts) jumped 0.8 percent. The broader S&P 500 (up 12.28 to 1,425.49, Charts) index and the tech-fueled Nasdaq (up 21.44 to 2,453.85, Charts) composite each rallied around 0.9 percent.
The Dow broke through a previous record closing high of 12,342.56 set Nov. 17. It also hit a new trading high of 12,431.26. The S&P 500 closed at its highest level since November 2000, taking out its previous 2006 high from early December. The Nasdaq closed about 12 points below its 2006 high. "The trend remains positive, you just can't fight it right now," said Greg Church, president at Church Capital. Since bottoming in July, stocks have been on a tear. Year-to-date, the Dow is up close to 16 percent, the S&P 500 has gained 14 percent and the Nasdaq has added 11 percent. The Russell 2000 (up 5.47 to 794.22, Charts) small-cap index has risen close to 18 percent this year. The dollar gained, bonds fell and oil climbed over a dollar as OPEC cemented plans for another production cut. Investors had few economic reports to consider but they'll be watching Friday's report on consumer prices for signs of inflation. Economists surveyed by Briefing.com are forecasting the core Consumer Price Index (CPI), which excludes often volatile food and energy prices, rose 0.2 percent last month, versus a 0.1 percent gain in October. Even if the core index comes in on the high side, investors may shrug it off, said Jim Awad, chairman of Awad Asset Management. "Earnings will trump interest rates," he said. "Even if inflation is disappointing, any negative reaction will be temporary." Friday also brings reports on capacity utilization and industrial production. Additionally, Friday is a "quadruple witching" day, a quarterly event in which individual stock futures and options and stock index futures and options all expire at the same time. This can lead to fluctuations in the prices of the underlying stocks in the days leading up to the expiration. Dell (Charts) was likely to be active in Friday trading. The PC maker said after the close Thursday that it will delay filing its third-quarter financial report because of ongoing investigations into its finances. (Full story). Adobe Systems (Charts) was likely to be an early gainer Friday. After the close Thursday, the software maker reported higher quarterly earnings and revenue, sending shares almost 5 percent higher in extended-hours trading. (Full story). Thursday's market Citigroup raised its target for the Dow and S&P and implied double-digit percentage gains by the end of 2007. The bank now expects the Dow to top 14,000 and the S&P to hit 1,600. Equities also benefited as the market continued the rally that began in the summer. Both Bear Stearns and Lehman Brothers reported higher quarterly earnings Thursday morning that beat estimates. Bear Stearns (up $4.07 to $159.96, Charts) shares rose, while Lehman (down $0.29 to $76.08, Charts) dipped. Intel (up $0.07 to $20.77, Charts), Dell (up $0.80 to $26.87, Charts) and Amazon.com (up $0.52 to $39.02, Charts) were among the big technology shares leading the Nasdaq higher. A variety of chip stocks jumped, including Altera (up $0.53 to $19.92, Charts), Advanced Micro Devices (up $2.54 to $22.71, Charts) and Xilinx (up $0.55 to $24.77, Charts). The Philadelphia Semiconductor (up 8.70 to 475.71, Charts) index, or the SOX, gained almost 2 percent. Ciena (up $2.87 to $27.83, Charts) jumped 12 percent after swinging to a profit in the latest quarter. The telecom gear maker also issued an upbeat first-quarter 2007 profit outlook. Market breadth was positive. On the New York Stock Exchange, winners topped losers two to one on volume of 1.57 billion shares. On the Nasdaq, advancers topped decliners three to two on volume of 1.94 billion shares. In economic news, a report showed a surprisingly large drop in the number of Americans filing new claims for unemployment last week. Investors also mulled the possibility of the Democrats losing control of the Senate amid news that a senator from South Dakota was in critical condition after suffering a brain hemorrhage. (Full story) U.S. light crude oil for January delivery surged $1.14 to settle at $62.51 a barrel on the New York Mercantile Exchange after OPEC said it would cut production by 500,000 barrels per day starting Feb. 1. Treasury prices fell, with the yield on the benchmark 10-year note rising to 4.60 percent from 4.58 percent late Wednesday. Bond prices and yields move in opposite directions. In currency trading, the dollar rose against the yen and euro. COMEX February gold slipped $1.50 to settle at $630.90 an ounce. |
|


