Stocks: Mixed day, brutal June
Dow and S&P 500 see the biggest losses for the month since the Great Depression despite edging higher Monday.

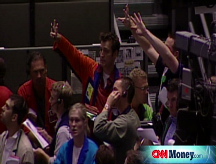

NEW YORK (CNNMoney.com) -- Stocks struggled Monday at the end of the worst June for the S&P 500 and the Dow industrials since the Great Depression, amid rocketing oil prices and ongoing financial market woes.
The Dow Jones industrial average (INDU) added a couple of points. The broader Standard & Poor's 500 (SPX) index gained 0.1% and the tech-heavy Nasdaq composite (COMP) lost 1%.
Stocks tumbled last week on a combination of record-high oil prices, a weak dollar and more bad news in the financial sector.
Considering the breadth of last week's selloff, Monday's mixed trade was far better than what could have been expected, said Greg Church, president at Church Capital.
The selloff last week briefly sent the Dow to a level at least 20% below the October highs, meaning it met the technical definition of a bear market. The S&P 500 is near bear levels. And the Nasdaq hit the technical definition of a bear market in March, falling 24% off its October highs, but has partially recovered since then.
Monday marks the end of a rough first half of the year on Wall Street. It is also the last day of a volatile month, and quarter.
"It's been a terrible June, something like the worst since the Great Depression," said Church.
The S&P 500 lost 8.6% in June, the worst monthly performance since September 2002 when it lost 11%, and the worst June performance since 1930, when it slumped 16.5%.
During the month, 91% of the industries in the S&P 500 declined, with almost of them falling by 10% or more, according to Sam Stovall, Standard & Poor's chief investment strategist.
The Dow lost 10.2% month-to-date, the worst monthly performance since September 2002 when it tumbled 12.4%, and the worst June performance since 1930, when it sank 17.7%.
The Nasdaq fell 9.1% - the worst monthly performance since this past January - when it lost 9.9%, and the worst June since 2002, when it shed 9.4%.
Monday also marks the last day of the second quarter and the first half.
In the second quarter overall, the Dow lost 7.4%, the S&P 500 lost 3.2% and the Nasdaq managed to gain 0.6%.
Year-to-date, the Dow is down 14.4%, the S&P 500 is down 12.8% and the Nasdaq is off 13.5%.
Church said that July doesn't look like it will be any better, with questions about fuel prices and the financial sector set to continue to rattle investors.
Oil volatile after record. U.S. light crude for August delivery reached a record high of $143.67 a barrel on the New York Mercantile Exchange before pulling back to settle at $140 a barrel, down 21 cents. (Full story).
Gas hits new high. The national average price for a gallon of regular unleaded gas rose to a record $4.086 from $4.079 the previous day, according to AAA. (Full story).
Company news. Blue chip stocks found some buyers on the last day of the quarter, while the tech-fueled Nasdaq slipped.
Oil stocks Chevron (CVX, Fortune 500), Exxon Mobil (XOM, Fortune 500), BP (BP) and Sunoco (SUN, Fortune 500) were among the big gainers. Beyond commodities, other gainers included biotech and select telecom stocks.
But an advance was limited by continued weakness in auto and financial stocks and some selling in technology.
General Motors (GM, Fortune 500) and Ford Motor (F, Fortune 500) both lost over 3% as investors continued to dump the stocks amid rising fuel prices. Both companies report June sales Tuesday and are expected to report big declines.
Citigroup (C, Fortune 500), Lehman Brothers (LEH, Fortune 500) and JP Morgan Chase (JPM, Fortune 500) were among the big bank stocks falling.
Brokerage Robert W. Baird cut earnings and price targets on a number of banks, including Comerica (CMA) and Wachovia (WB, Fortune 500), according to the Associated Press.
H&R Block (HRB) reported improved quarterly sales and earnings that topped estimates, thanks to a strong tax season and the sale of its mortgage unit. Shares gained 3.7%.
Anheuser-Busch (BUD, Fortune 500) said it's cutting 10% to 15% of its workforce and that it expects 2008 and 2009 earnings per shares that are higher than analysts' current forecasts. The parent of Budweiser beer is trying to make itself more valuable than the $65-a-share offer from InBev it rejected last week. Shares were little changed Monday.
Market breadth was mixed. On the New York Stock Exchange, winners beat losers by three to two on volume of 1.61 billion shares. On the Nasdaq, decliners beat advancers three to two on volume of 2.11 billion shares.
Manufacturing remains under pressure. The Chicago PMI, a regional read on manufacturing, rose to 49.6 from 49.1 in the previous month, versus forecasts for a dip to 48. However, any reading below 50 indicates continued weakness in the sector.
Other markets: In currency trading, the dollar was little changed versus the euro and fell versus the yen.
In the bond market, Treasury prices were barely higher, with the yield on the benchmark 10-year note at 3.96%. Bond prices and yields move in opposite directions.
COMEX gold for August delivery fell $3 to settle at $928.30 an ounce. ![]()


