Find your top companies
 High revenue growth  High profit growth
 Based in Asia  Based in Europe
 Based in U.S.  Top 5 in its industry
 Big employer  Small employer
SUBMIT


U.S. 153
Japan 64
France 39
U.S. Postal Service 785,929
Sinopec 634,011
Hon Hai Precision Industry 550,000
Exxon Mobil $40,610
Royal Dutch Shell $31,331
General Electric $22,208
FAQ and methodology
All companies on the list must publish financial data and report part or all of their figures to a government agency. In the U.S., private companies and cooperatives... More
Current Issue
  • Give the gift of Fortune
  • Get the Fortune app
  • Subscribe
  • All
    companies
  • All
    industries
85 of 500
BACKNEXT
85. Vodafone
Financials: Latest Results
Rank: 85 (Previous rank: 95)
CEO: Vittorio Colao
Employees: 72,000
Address: The Connection
Newbury  RG14 2FN
Country: Britain
Website: www.vodafone.com
Revenues 71,201.5 19.0
Profits 13,366.1 N.A.
Assets 252,949.0
Stockholders' equity 155,110.4
Revenues 19
Assets 5
1 AT&T 29 118,928.0
2 Verizon Communications 53 93,775.0
3 Nippon Telegraph & Telephone 54 93,526.9
4 Deutsche Telekom 64 85,569.5
5 Telefónica 76 77,254.3
6 France Télécom 84 72,488.3
7 Vodafone 85 71,201.5
8 China Mobile Communications 148 47,055.2
9 Telecom Italia 160 43,393.9
10 BT 166 42,251.7
11 Sprint Nextel 176 40,146.0
12 KDDI 243 31,490.7
13 Comcast 248 30,895.0
14 Vivendi 264 29,643.3
15 América Móvil 283 28,513.2
16 China Telecommunications 288 27,856.4
17 Softbank 330 24,309.4
18 KT 387 21,687.0
19 Telstra 448 18,815.0
20 Carso Global Telecom 464 17,981.7
21 Royal KPN 486 17,290.2
22 DirecTV Group 487 17,246.0
From the July 21, 2008 issue
Figures prepared in accordance with International Accounting Standards.
Figures are for fiscal year ended March 31, 2008.
See Vodafone in...
...Featured Companies
Most profitable
Exxon Mobil again tops Fortune's list of top earners. Which other companies are among the most profitable on the planet?
See them all
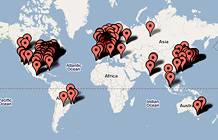
...Top 50 Headquarters
MAPS
...What Readers Say
They speak out on Vodafone and other 500 companies...


Most stock quote data provided by BATS. Market indices are shown in real time, except for the DJIA, which is delayed by two minutes. All times are ET. Disclaimer. Morningstar: © 2018 Morningstar, Inc. All Rights Reserved. Factset: FactSet Research Systems Inc. 2018. All rights reserved. Chicago Mercantile Association: Certain market data is the property of Chicago Mercantile Exchange Inc. and its licensors. All rights reserved. Dow Jones: The Dow Jones branded indices are proprietary to and are calculated, distributed and marketed by DJI Opco, a subsidiary of S&P Dow Jones Indices LLC and have been licensed for use to S&P Opco, LLC and CNN. Standard & Poor's and S&P are registered trademarks of Standard & Poor's Financial Services LLC and Dow Jones is a registered trademark of Dow Jones Trademark Holdings LLC. All content of the Dow Jones branded indices © S&P Dow Jones Indices LLC 2018 and/or its affiliates.