Rank: 3 (Previous rank: 3)
CEO: Jeroen van der Veer
Employees: 104,000
Address: Carel van Bylandtlaan 30
The Hague 2596
Country: Netherlands
Website: www.shell.com
In the face of the current energy crisis, Royal Dutch Shell has made its own moves to ensure the company�s future. Two large projects included acquiring a 22% stake in Shell Canada - increasing its access to the vast oil sands in Alberta - and moving forward with Pearl GTL, a gas-to-liquids plant in Qatar.
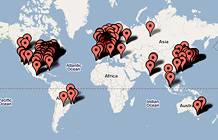
But the year wasn�t without glitches. Shell saw its stake in one of its biggest projects - the Russian-based Sakhalin II - reduced to 27% from 55%, as the Russian government asserted control over the country's oil industry.
|
| Revenues |
355,782.0 |
11.6 |
| Profits |
31,331.0 |
23.1 |
| Assets |
269,470.0 |
— |
| Stockholders' equity |
123,960.0 |
— |
| 4 | Chevron | 6 | 210,783.0 | | 5 | Total | 8 | 187,279.5 | | 6 | ConocoPhillips | 10 | 178,558.0 | | 7 | Sinopec | 16 | 159,259.6 | | 8 | China National Petroleum | 25 | 129,798.3 | | 9 | ENI | 27 | 120,564.7 | | 10 | Valero Energy | 49 | 96,758.0 | | 11 | Statoil Hydro | 59 | 89,223.9 | | 12 | Petrobras | 63 | 87,735.0 | | 13 | SK Holdings | 86 | 70,716.9 | | 14 | Lukoil | 90 | 67,205.0 | | 15 | Repsol YPF | 92 | 67,006.4 | | 16 | Petronas | 95 | 66,218.2 | | 17 | Marathon Oil | 108 | 60,044.0 | | 18 | Indian Oil | 116 | 57,427.0 | | 19 | Nippon Oil | 117 | 57,049.2 | | 20 | PTT | 135 | 51,192.5 | | 21 | Sunoco | 168 | 42,101.0 | | 22 | Rosneft Oil | 203 | 36,184.0 | | 23 | Reliance Industries | 206 | 35,914.9 | | 24 | Nippon Mining Holdings | 215 | 35,139.5 | | 25 | Hess | 240 | 31,924.0 | | 26 | Idemitsu Kosan | 262 | 29,843.9 | | 27 | GS Holdings | 267 | 29,476.7 | | 28 | Bharat Petroleum | 287 | 27,872.8 | | 29 | Hindustan Petroleum | 290 | 27,717.9 | | 30 | OMV Group | 295 | 27,432.8 | | 31 | Cosmo Oil | 302 | 26,568.0 | | 32 | Cepsa | 313 | 25,853.2 | | 33 | CPC | 324 | 24,808.0 | | 34 | Tesoro | 388 | 21,675.0 | | 35 | Formosa Petrochemical | 395 | 21,343.8 | | 36 | Petro-Canada | 430 | 19,788.8 | | 37 | Murphy Oil | 456 | 18,439.1 | | 38 | PKN Orlen Group | 477 | 17,567.3 | | 39 | Galp Energia | 484 | 17,331.3 |
|
From the July 21, 2008 issue
|
|
See Royal Dutch Shell in...
|