Rank: 4 (Previous rank: 4)
CEO: Anthony B. Hayward
Employees: 97,600
Address: 1 St. James Sq.
London SW1Y 4PD
Country: Britain
Website: www.bp.com
Another tumultuous year for the oil giant: BP was forced to clean up its Whiting, Ind., refinery after it was hit by the EPA with clean-air violations, faced multiple fires on its Alaskan oil fields, and had to deal with the departure of Chief Executive and Director John Browne.
Much of the U.K.-based company�s time was spent handling its U.S. operations, as it modernized Whiting and dealt with the repercussions of the 2005 blast in Texas City. Yet the American operations weren�t all bad news - a $2.4 billion investment in the San Juan basin and deepwater drilling projects in the Gulf could be helpful in the next few years, once BP�s messes are behind it.
|
| Revenues |
291,438.0 |
6.2 |
| Profits |
20,845.0 |
-5.3 |
| Assets |
236,076.0 |
— |
| Stockholders' equity |
93,690.0 |
— |
| 4 | Chevron | 6 | 210,783.0 | | 5 | Total | 8 | 187,279.5 | | 6 | ConocoPhillips | 10 | 178,558.0 | | 7 | Sinopec | 16 | 159,259.6 | | 8 | China National Petroleum | 25 | 129,798.3 | | 9 | ENI | 27 | 120,564.7 | | 10 | Valero Energy | 49 | 96,758.0 | | 11 | Statoil Hydro | 59 | 89,223.9 | | 12 | Petrobras | 63 | 87,735.0 | | 13 | SK Holdings | 86 | 70,716.9 | | 14 | Lukoil | 90 | 67,205.0 | | 15 | Repsol YPF | 92 | 67,006.4 | | 16 | Petronas | 95 | 66,218.2 | | 17 | Marathon Oil | 108 | 60,044.0 | | 18 | Indian Oil | 116 | 57,427.0 | | 19 | Nippon Oil | 117 | 57,049.2 | | 20 | PTT | 135 | 51,192.5 | | 21 | Sunoco | 168 | 42,101.0 | | 22 | Rosneft Oil | 203 | 36,184.0 | | 23 | Reliance Industries | 206 | 35,914.9 | | 24 | Nippon Mining Holdings | 215 | 35,139.5 | | 25 | Hess | 240 | 31,924.0 | | 26 | Idemitsu Kosan | 262 | 29,843.9 | | 27 | GS Holdings | 267 | 29,476.7 | | 28 | Bharat Petroleum | 287 | 27,872.8 | | 29 | Hindustan Petroleum | 290 | 27,717.9 | | 30 | OMV Group | 295 | 27,432.8 | | 31 | Cosmo Oil | 302 | 26,568.0 | | 32 | Cepsa | 313 | 25,853.2 | | 33 | CPC | 324 | 24,808.0 | | 34 | Tesoro | 388 | 21,675.0 | | 35 | Formosa Petrochemical | 395 | 21,343.8 | | 36 | Petro-Canada | 430 | 19,788.8 | | 37 | Murphy Oil | 456 | 18,439.1 | | 38 | PKN Orlen Group | 477 | 17,567.3 | | 39 | Galp Energia | 484 | 17,331.3 |
|
From the July 21, 2008 issue
|
|
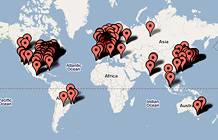
See BP in...
|