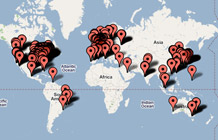
| Industry median rank |
Industry |
2008 $ |
| 1 | Petroleum Refining | 3,044,000 | | 2 | Wholesalers: Health Care | 2,027,600 | | 3 | Energy | 1,360,705 | | 4 | Diversified Financials | 1,307,001 | | 5 | Food Production | 1,268,695 | | 6 | Trading | 1,025,257 | | 7 | Health Care: Insurance and Managed Care | 1,001,605 | | 8 | Insurance: Life, Health (stock) | 960,056 | | 9 | Utilities | 910,711 | | 10 | Insurance: Property and Casualty (Stock) | 753,100 | | 11 | Mining, Crude-Oil Production | 697,695 | | 12 | Shipping | 666,363 | | 13 | Banks: Commercial and Savings | 653,314 | | 14 | Chemicals | 639,935 | | 15 | Telecommunications | 522,884 | | 16 | Entertainment | 515,563 | | 17 | Metals | 490,863 | | 18 | Pharmaceuticals | 483,817 | | 19 | Network and Other Communications Equipment | 471,031 | | 20 | Tobacco | 445,043 | | 21 | Motor Vehicles and Parts | 439,042 | | 22 | Industrial Machinery | 411,165 | | 23 | Household and Personal Products | 377,281 | | 24 | Beverages | 345,714 | | 25 | Food Consumer Products | 340,879 | | 26 | Building Materials, Glass | 336,281 | | 27 | Airlines | 327,138 | | 28 | Aerospace and Defense | 304,323 | | 29 | Engineering, Construction | 298,990 | | 30 | Computers, Office Equipment | 292,773 | | 31 | Electronics, Electrical Equip. | 282,660 | | 32 | Food and Drug Stores | 279,669 | | 33 | Specialty Retailers | 279,386 | | 34 | General Merchandisers | 189,092 | | 35 | Mail, Package, and Freight Delivery | 135,098 |
|
From the July 20, 2009 issue
|
|
|


